| Supported Collector Type |
|---|
| Gateway |
| Supported Target Versions |
|---|
| MySQL Server 2008 or higher |
| JDBC: 8.0.17 |
| Privilege | Description | Example |
|---|---|---|
| SELECT | Minimum privilege to monitor all G2 templates | GRANT SELECT ON *.* TO 'username'@'%'; |
This describes the discovery and monitoring setup for the MySQL database.
Introduction
The objective of this document is to help completely new users create query based (MySQL) custom monitors development in the OpsRamp. This document provides a complete user guide to implement MySQL query based metrics and create monitors and templates. It also explains prerequisites, limitations, troubleshooting steps, and FAQs related to MySQL DataBase Monitoring.
What is MySQL Database Monitoring?
MySQL Database Monitoring offers readily available performance metrics, which enables users to effortlessly visualize the health and availability of their MySQL Database environment. Users can access and view the status updates and performance metrics specific to MySQL servers through the OpsRamp portal.
How MySQL Database Monitoring works
This monitoring functionality operates to executing MySQL queries on target MySQL servers via a Gateway using JDBC connections. Users must adhere to the following prerequisites.
Prerequisites
- Database and port(3306) that can be accessible by the gateway
- A gateway management profile mapped to a resource.
- Credentials with type set to Database before assigning a template to a resource. The Port, Connection Time-out, and Is Secure values are not used while creating credentials.
Database discovery and monitoring
The administrator can deploy an agent or gateway to support MySQL server agent-based or agentless monitoring respectively.
Discovery with the agent
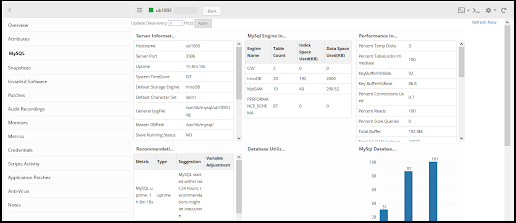
The agent auto-discovers the MySQL database and collects the following metric information:
- MySQL-Engine information
- MySQL-Recommendations
- MySQL-Database information
- MySQL-Performance information
- MySQL-Slave information
- MySQL-Server information
- MySQL-Variable information
- MySQL-Status information
You can also apply agent-based templates to initiate monitoring.
Discovery with the gateway
The gateway establishes a connection to the database using Java Database Connectivity (JDBC) Java API and collects monitoring metrics using SQL queries. To monitor the MySQL database, install gateway version 5.0.0 or later.
Use one of the following mechanisms to discover MySQL servers to add them to your inventory:
- WMI
- SSH
- SNMP
Optionally, add a database server manually to the infrastructure inventory:
- Select Infrastructure and click Resources.
- Click the Settings icon on the top-right and click Add.
- On the Add Device page, enter the Device Type and any other information you want to enter.
- Click Save.
Prepare the device to start monitoring
- Associate appropriate database credentials to the discovered database.
- Assign one or more database-specific global monitors or templates on the device.
Optionally, you can create custom metrics or monitors using SQL queries and assign them to the database.
To track monitoring of MySQL database in your cloud environment, see Monitoring Cloud Database using Gateway.
How to develop & create MySQL metric
OpsRamp comes with a predefined set of MySQL metrics. However, for users who want any customization and the ability to create their own monitoring solutions, we offered UI-based support for creating MySQL metrics.
To prepare a MySQL query based metric, users must return max one or two fields from the query. Follow the below usecases along with examples to understand how to write queries to monitor MySQL environment.
Prepare a MySQL metric query
Metric with no components: If the user wants to prepare a metric query for the direct value without any components then user should return only one column from the query result. The value will be consider as metric value.
Example: To monitor the free pages count of the Innodb buffer pool.
Query: show status where variable_name like “Innodb_buffer_pool_pages_free”
The above metric query output is the value of the Innodb buffer pool pages free. The framework should consider the value as metric value.
Example: To monitor count of Deleted commands (per second).
Query - show global status like ‘Com_delete’
Above metric query output is the value of the count of deleted commands, Here our framework should consider the value as metric value.
Metric with multiple components: If the user wants to prepare a metric query for multiple component based metrics, then the user should return to two columns from the query result. Here column 1 will be considered as component name and column 2 will be considered as metric value.
Example: To monitor the disk space usage for databases and tables in MySQL.
Query - SELECT table_name, round(((data_length + index_length) / 1024 / 1024), 2) AS size_in_mb FROM information_schema.TABLES

Here framework should consider first column table_schema as component name and second column total_mb as metric value.
Note
- Users must follow these usecases while preparing queries for DB query based monitoring.
- If the user prepares metric query for multiple components, then the OpsRamp framework showcase component names in the following format:
or <Port_InstanceName-ComponentName> (Port number added if target environment having multiple instances with different ports). - Metric query returns max two columns only. If it returns one column consider as metric value & If it returns two columns, first column as componentName and another column as metric value.
- Metric value could be number only, If it returns string-type values then must use enumarated mappings otherwise graphs are not plotted.
Calculating and Formatting Metric Values
To calculate metric values like utilization, memory usage conversions, or time conversions.
Example: To monitor the uptime (in minutes) of the MySQL.
Query: select (VARIABLE_VALUE/60) as uptime from information_schema.GLOBAL_STATUS where VARIABLE_NAME=‘Uptime’;

Example: To monitors the size (MB) of each table in all databases.
Query: SELECT table_name, ROUND(((data_length + index_length) / 1024 / 1024), 2) AS size_in_mb FROM information_schema.TABLES

Enumerated Mapping and Alerting
Enumerated Map: OpsRamp monitoring framework exclusively supports integer-type metric values. Therefore, users are required to return metric values as integers rather than strings or other data types. If users wish to return metric values as strings, an option for enumerated mappings is available. Below are examples providing further clarification.
Example: To monitor the running status of MySQL Slave, it’s important to note that MySQL Slave have direct possible states. In such cases, users must prepare a query to directly return the status value.
Query: MySQL_slave_Sql_Running_Status
When creating a metric, users are required to select the Datapoint Value Conversion option as Enumerated Map and provide integer value mappings for each possible state.

Additionally, there is an option to enable Use formatted value in Alerts & Graphs. If users opt to enable this feature, the enumerated mapping values provided will affect Alerts & Graphs. Otherwise, these values will not be reflected anywhere.
Alerting: If the metric has an enumerated map enabled, users must follow the instructions below to select critical and warning alert conditions for alert creation.
- As outlined above, the prepared query returns the metric value as a string type. In accordance with this, users need to add N-number of enum maps for each possible state to different integer values.
- To enable critical or warning alerts, users must take into account the possible string-type values returned from the query.
- If the enumerated map (string to integer) is enabled, refer to the screenshot below to enabled critical alerts:

- If the enumerated map (integer to string) is enabled, refer to the screenshot below to enabled critical alerts:

How to Create a MySQL Metric
Login to OpsRamp platform and navigate to Setup from top menu. Navigate to Monitoring from the side bar menu and click on Metrics.
Click on +Add to create a new metric. The Create Metric screen appears with the following parameter fields:
- Metric Scope: Select either Service Provider Metric or Partner or Client Metric. Based on your access level and role, you might see this menu slightly different. If you have chosen Partner or Client Metric you will be prompted to choose a Partner/Client from contextual drop down which is dynamically populated.
- Adapter Type: Select Application from this dropdown.
- Application Type: Select **MySQL from the dropdown.

- Name: The metric name.
- Tag Name: This field is automatically populated with the metric name.
- Display Name: The metric display name.
- Description: A description of the metric.
- SQL Query: Provide the prepared MySQL query.

- Data Point Type: Choose a type from the dropdown list.
- Counter Delta: It calculates delta on top of metric value. Counter Delta = (Current poll value - Prev poll value) Note: If the result is less than zero then it returns zero.
- Counter Rate: It calculates rate on top of metric value. Counter Rate = (Current poll value - Prev poll value) / (Current poll time - Prev poll time) Note: If the result is less than zero then it returns zero.
- Derive Delta: No support in both agent and gateway.
- Derive Rate: No support in both agent and gateway.
- Gauge: Returns direct metric value, which is returning from the script.
- Rate: It calculates rate on top of metric value. Rate = (Current poll value - Prev poll value) / (Current poll time - Prev poll time) Note: If the result is less than zero then it returns negative value.
- Delta: It calculates delta on top of metric value. Delta = (Current poll value - Prev poll value) Note: If the result is less than zero then it returns negative value.
- None: Same as gauge.
- Units: Choose a suitable unit from this dropdown. For status related metrics that don’t require any units, select None.
- Unit Multiplication Factor: Value to multiply the metric by. As this is status monitor, it doesn’t required this factor value and can use the default value 1.0.
- Datapoint value conversion: Choose a suitable option from any of the below two.
- Value: Choose this option when no conversion required on the metric value. This is the default value.
- Enumerated Map: Choose this option when enumeration based conversion is required. For status-related metrics, it’s common for queries to return string-type values. However, our monitoring graphs only support integer values. Therefore, users need to provide mappings for all possible string-type values.

- Metric Processing: Choose from the dropdown.
- Graph: Select this if a graph is needed, but no alerting is needed.
- Notification: Select if alerting is only needed, but no graphing is needed.
- Graph and Notification: Select if both graphing and alerting is needed.
- None: Select if both graphing and alerting is not needed.
How to Create a MySQL Monitor
- Login to the OpsRamp platform and .lick on Setup from top menu. Navigate to Monitoring from the side bar menu and click on Monitors.
- Click on +Add to create a new monitor. The Create a Monitor screen appears.
- Configure the parameters on the screen:
- Monitor Scope: Select either Service Provider Monitor or Partner or Client Monitor. Based on your access level and role, you might see this menu slightly different. If you have chosen to create the script at Partner or Client level you will be prompted to choose a Partner/Client from contextual drop down which is dynamically populated.
- Adapter Type: Select Application from this dropdown.
- Application Type: Select MySQL from this dropdown.
- Name: Provide a name for the monitor.
- Description: Provide a description for the monitor.
- Metrics: Click on Add and select all the metrics created in the previous section.
- Configuration Parameters: By default, you will see below 4 configuration parameters:
- collector.application.type – Proceed with the default values, i.e MySQL
- connection.timeout.ms – Proceed with the default value, i.e 15000 ms (If require, you can increase it but it should be well within the monitor frequency/poll time)
- MySQL.service.port - Proceed with the default value, i.e 3306 (If target MySQL environment running on different port then change it to right port number)
- MySQL.service.transport - Select correct secure/insecure transport type.
- MySQL.dbname.list - Provide database instance name here.
- If target MySQL environment have multiple database instances running on same port, provide input like InstanceName1, InstanceName2, etc.
- If target MySQL environment have multiple database instances and each one running on different ports, provide input like InstanceName1:Port1, InstanceName2:Port2, etc.
How to create MySql Database Monitoring Template
Login to OpsRamp platform and click on Setup from top menu and expand Monitoring from the side bar menu and click on Templates.
Click on +Add to create a new template.
Configure the following fields on the Monitor Template screen:
Select Template Scope: Select either Service Provider Template or Partner or Client Templates. Based on your access level and role, you might see this menu slightly different. If you have chosen to create Partner or Client level you will be prompted to choose a Partner/Client from contextual drop down which is dynamically populated.
Collector Type: Choose Gateway (Note - DB Query based monitoring supports Gateway collector type only).
Monitor Type: For Gateway, select Monitors radio button.
Applicable For: Always select Device
Template Name: Provide a meaningful template name.
Description: Provide an elaborate description about this template.
Leave remaining fields as is and go to the bottom, Click on +Add against Monitors.
Select Frequency: Select monitoring frequency based on metric requirement
Monitor Definition: Choose monitor which you created in the previous section
When To Alert: Proceed with the default option. i.e Breach of a Threshold
Then click Add to save the template.
Assign templates from setup
Assign MySQL templates to one or more resources for a selected client and change the configuration parameters while assigning templates. For more information, see Assign Templates from Setup.
Assign templates at the device level
Applying MySQL templates at the device level helps you to assign one or more templates to a specific resource. You can change the configuration parameter default values while assigning the templates. For more information, see Assign Templates at the Device Level.
Template configuration parameters:
| Configuration Parameter | Description |
|---|---|
| Connection Time-out | The maximum time to connect to the database. The driver waits for the specified time before timing out due to connection failure. The default time is 15000 milliseconds(ms). |
| Service Transport Type | To configure the database at a secure end-point. The default type is In-secure. The connection is Secure when the data sent between the client and server is encrypted. |
| Service Port | The port number where the database is running. The connection is made to the specified port if you specify the port and the database name. The default port is 3306. |
| DB Instance Name | The name of the database to connect to. The default name is root.
|
Assign template from device management policies
Device management policies help manage resources. You can assign monitoring templates, knowledge base articles, and custom attributes using device management policies. The device management policy can be applied to one or a set of resources. For more information, see Create Policies.
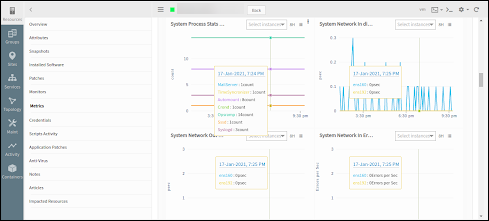
View resource metrics
The gateway monitors the application using the assigned templates and displays the results in graphical format. To view resource metrics, click the database resource name > resource Details > Metrics.
Points to Consider
Consider the following points when configuring MySQL Query Based Monitoring:
- Gateway collector type only supports MySQL query based monitoring.
- To assign the right MySQL database credentials (which are have proper privileges to execute metric queries) on the target MySQL server.
- If the user has instance level authentication, they need to assign all credential sets on the target MySQL server. OpsRamp Gateway will take care to connect the different instances of the MySQL server.
- The user needs to provide an correct instanceName(s) to connect the MySQL DB.
- Provide right transport type like secure or insecure
- While preparing MySQL query, User should not consider frequently changed fields as component names (like MySQL session name, userName, ..etc) or any combinations (like databaseName_sessionId, databaseName+userId, …etc).
- If any database connectivity issues occur from the Gateway, the Framework generates alerts such as ‘oracledb.auth.error.’ However, it does not generate alerts for query syntax errors, empty data, or access denied issues.
Troubleshooting
Usecase 1 - Failed to get latest metric values/Gateway is offline
When the user applies a MySQL monitoring template on devices and encounter the message “Failed to get latest metric values/Gateway is offline” while fetching latest metric data, follow these troubleshooting steps:
- Navigate to the Overview section of the device (Infrastructure > Resources > Search using IP or Device Name) and on that device, ensure that the Gateway is online (indicated by blue color as shown below).

- Identify whether a template is global or customer written.
- Review any alerts associated with the template on the Overview page of the device. Alternatively, you can navigate to Command Center > Alerts page and filter using the specific server name or Ip address. The alert format is static with the metricName as MySQL.auth.error and the component name like
. - Check key points related to MySQL monitoring.
- Access the gateway. This can be done using SSH or by logging in using the browser console from the device page. You can navigate to the console by clicking on the console and filling in the necessary fields.

Check database server IpAddress & port connectivity
- Login to the gateway
- Refer Step-5: Access gateway
- Type ping
and press enter, then telnet as below:

- Login to the gateway
Connect to the GCLI terminal in gateway:
- Classic Gateway:
- Login to the gateway
- Refer Step-5: Access gateway
- Type gcli and press enter, then gcli terminal will open.
- Login to the gateway
- Nextgen Gateway:
- Login to the gateway
- Refer Step-5: Access gateway
- Execute command kubectl exec -it nextgen-gw-0 -c vprobe -n
– bash Note: Here we need to replace the if applicable, otherwise execute. kubectl exec -it nextgen-gw-0 -c vprobe -- bash - Type gcli and press enter, then gcli terminal will open
- Login to the gateway
- Classic Gateway:
Access MySQL logs By default the OpsRamp gateway capturing error logs, If user want to enable all available logs which are related to MySQL DB then follow below steps:
- Access gcli mode by running: gcli
- Refer Step-7: Connect to GCLI terminal in gateway
- Use this command to enable debug logs: flag add MySQL.log on 30
- Exit gcli prompt and run this command to observe logs: sudo tail -100f /var/log/app/vprobe.log
- In Nextgen Gateway, If User want to copy files from the vprobe container to the gateway cli, execute the following command after exiting the container
kubectl cp <namespace>/nextgen-gw-0:<source_path> <dest_path> -c vprobeExample: kubectl cp nextgen-gw-0:/var/log/app/vprobe.log /home/gateway-admin/vprobe.log -c vprobe - Download files from the gateway cli.
- Access gcli mode by running: gcli
Execute MySQL query manually from the GCLI on the target machine.
- Access gcli mode by running: gcli
- Refer Step-7: Connect to GCLI terminal in gateway
- Execute MySQL query via gcli prompt:
db MySQL <Ipaddress> <username> <password> <port> <InstanceName> 15000 10000 insecure <Yes/No> <"Query">
- Access gcli mode by running: gcli
If you are unable to determine the root cause of the issue from the logs or query output, or if different exceptions occur when executing an MySQL query, please raise a case and attach the relevant logs and manual query output.
Usecase 2 - Graph data is not populating for specific or all metrics
- Validate whether the metric is retrieving data from end device by checking latest snapshot data., if not refer to Usecase 1.
- Check if the graph is enabled or not at metric level. If its enabled, check whether the data got from latest snapshot data is a string. If it’s a string, then check if Enum Mapping is defined for that string at metric level.
- If Enum mapping is not defined for that particular string and it’s a global template, then raise a case while attaching screenshots of latest snapshot data, Enum Mapping defined at Metric.
- If Enum mapping is not defined for that particular string and it’s a customer written template, then suggest customer to edit the metric and add this new state in State Descriptions field.
Usecase 3 - User is observing gaps in metric graphs.
This issue might be due to the following reasons:
- Gateway going offline at that time
- The device is not reachable and port connectivity issues.
- There may be no data available for the metric on the device at that time.
- Please check the debug level logs to cross verify if Gateway was offline at that time.
If you do not find any logs related to those, then raise a case while attaching logs, to analyze query output at those specific times when graph is not populating.
Usecase 4 - Alerts not getting generated on resource for particular metric.
Check latest snapshot data to see if we are retrieving any data from device for that metric and also verify the thresholds defined for the metric.
If the latest snapshot data is also not coming for that metric, then execute the command or script manually on device, to see if any data exists for that metric.
Usecase 5 - Alerts generated do not align with the defined alert thresholds
Refer to the Alerts Hierarchy outlined below:
Alert Thresholds Precedence Order: Template level threshold > Device level threshold > Component level threshold
Alert thresholds follow a hierarchical order, starting from the component level and moving up to the template level. Each level can override the thresholds set at the previous level. Component-level settings override those set at the device level, and device-level settings take precedence over template-level settings.
This hierarchy ensures that monitoring configurations can be finely tuned at various levels of the system, allowing for granular control over alerting parameters. This approach enables more precise and effective management of alerts tailored to the specific needs of each level.
FAQ’s
- Why is the latest snapshot data not available?
Answer: Refer to Usecase 1 - Failed to get latest metric values/Gateway is offline.
- Why are graphs not reflecting?
Answer: Check Points to be Considered & Usecase2 - Graph data is not populating for specific or all metrics.
- Why is the
mysql.auth.erroralert generated like below?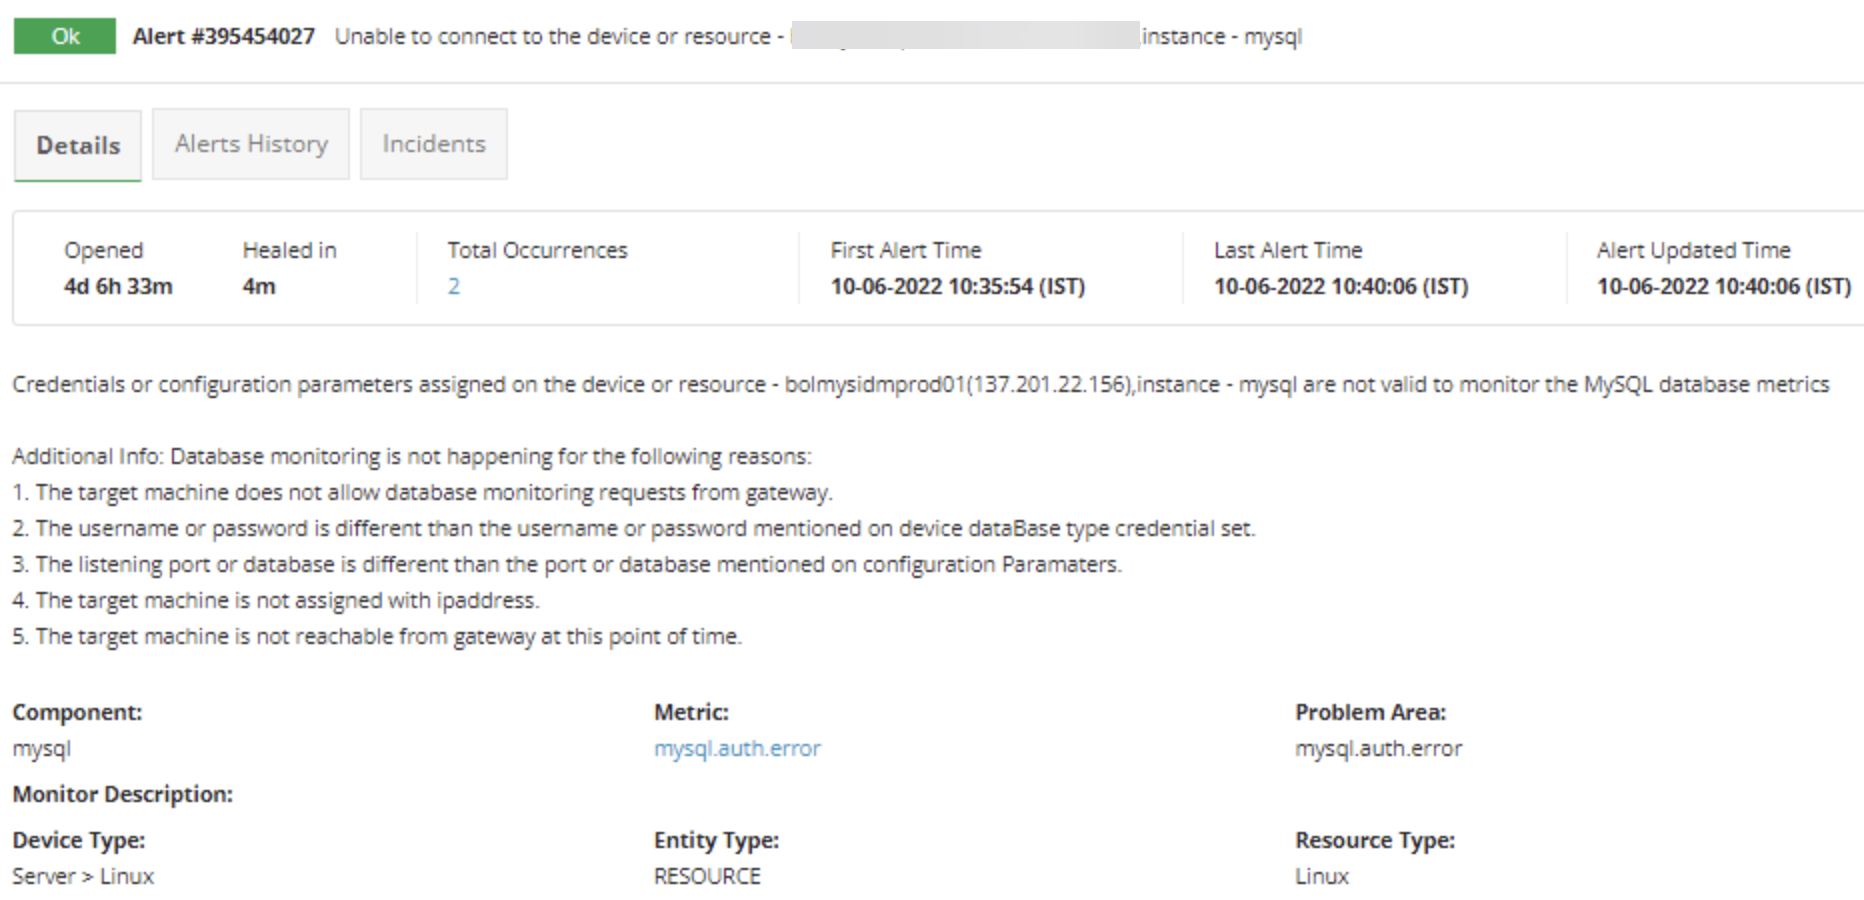
Answer: Refer to Usecase 1 - Failed to get latest metric values/Gateway is offline.
- What are the possible MySQL exceptions?
Answer: Below are few possible exceptions while connecting MySQL server. - Access denied for user ‘username’@‘host’ (using password: YES/NO) - Unknown database ‘database_name’ - Unable to connect to any of the specified MySQL hosts. - Timeout and Socket Exceptions. - The connection is already open. - The connection is closed.
- Where to check OpsRamp supported MySQL Metrics
Answer: Customers should check the Recommended Templates page within the public documentation. If the required monitoring support is not found on these pages and it’s a generic request applicable beyond the customer’s specific needs, then only submit a case to support team for Request for Enhancement (RFE).
However, if the monitoring requirement is specific to the customer’s needs, then customers need to develop their own script by following this documentation.
- How to identify whether a template is global or customer written?
Answer: The details available in the links below only pertain to Global Templates and Metrics.
- Latest metric snapshot data is not getting from the template.
Answer: Refer to Usecase 1 - Failed to get latest metric values/Gateway is offline.
- What steps should an user follow if they want to create their own query based custom metric for database monitoring?
Answer: Users can refer to the Create Custom Metrics guide available in the public documentation.
This guide provides comprehensive instructions on how to develop query based custom metrics.
- Can customer create query based metrics using Agent collector type?
Answer: No, Query-based metrics only work with collector type Gateway, not with Agent.
- How to plot Graph for String values like health or status metrics?
Answer: To plot graph for state or status-related metrics returned as strings, utilize the Enumerated Mapping option.
- Why metrics and monitor changes are not getting reflected in template (latest metric data or graphs or alerts)?
Answer: Refer to How to update & add metrics to Monitor & Monitor to template.
- User wants to exclude monitoring for some components of metric. How can they achieve this?
Answer: If User wants to exclude monitoring some components of metric, then suggest them to use Component Filters option of RSE.
By using these component filters, you can monitor specific components or ignore unwanted components from monitoring.
- For MySQL monitoring, should SSH credentials assigned on the target device or on the Gateway device?
Answer: In MySQL monitoring, No need to assign the SSH login credentials on the target device, not on the Gateway device.
- Authentication error alerts (Dtabase Related) observed on device Overview page.
Answer: If it’s MySQL query based template, make sure that MySQL Database Type credentials are assigned in device’s credentials tab.
- Observed any MySQL Query execution errors on device like permissions error
Answer: Assigned Database Type credentials must have sufficient permissions to execute the query on the device.
- User wants to know the queries used for template.
Answer: Go to the Setup page. Navigate to Monitoring, then Click on Metrics and Search the exact metric based on scope. Open the metric definition. Monitoring query available on the metric definition
- Can a user assign version 1 and version 2, 3, 4 etc of a template on the same device?
Answer: No, User cannot assign version 1 and version 2, 3, 4, etc., of a template to the same device simultaneously. In nearly all cases, the metrics present in version 1 (v1) will also be included in version 2 (v2) or later versions. The later versions typically include additional metrics, enhancements to existing metrics or methodologies, and bug fixes. Therefore, we recommend always using the latest version of the template to ensure that users benefit from these improvements and new features.
Supported templates
| Collector Type | Template Name |
|---|---|
| Agent | MySQL Global Performance Statistics |
| MySQL InnoDB Statistics | |
| MySQL Variable Statistics | |
| Gateway | Advanced Cloud Database Template for MySQL |
| Advanced Cloud MySQL Database Command Template | |
| Advanced Cloud MySQL Database Connection Template | |
| Advanced Cloud MySQL Database innoDB Template | |
| Advanced Cloud MySQL Database Miscellaneous Template | |
| Advanced Cloud MySQL Database Network Template | |
| Advanced Cloud MySQL Database Table Template | |
| Advanced Cloud MySQL Database Threads Template | |
| G2 MySQL Database Command Template | |
| G2 MySQL Database Connection Template | |
| G2 MySQL Database innoDB Template | |
| G2 MySQL Database Miscellaneous Template | |
| G2 MySQL Database Network Template | |
| G2 MySQL Database Table Template | |
| G2 MySQL Database Threads Template |
Supported metrics
| Metric | Metric Display Name | Unit |
|---|---|---|
| MySQL_slave_Seconds_Behind_Master MySQL Slave behind master in seconds | MySQL Slave behind Master | Seconds (s) |
| MySQL_slave_IO_State Input/output state of slave, returns 1- if io state is "Checking master version". 2 - if io state is "Connecting to master". 3 - if io state is "Queueing master event to the relay log". 4 - if io state is "Reconnecting after a failed binlog dump request". 5 - if io state is "Reconnecting after a failed master event read". 6 - if io state is "Registering slave on master". 7 - if io state is "Requesting binlog dump". 8 - if io state is "Waiting for its turn to commit". 9 - if io state is "Waiting for master to send event". 10 - if io state is "Waiting for master update". 11 - if io state is "Waiting for slave mutex on exit". 12 - if io state is "Waiting for the slave SQL thread to free enough relay log space". 13 - if io state is "Waiting to reconnect after a failed binlog dump request". 14 - if io state is "Waiting to reconnect after a failed master event read". | MySQL Slave IO State | |
| MySQL_Replication_Status Returns 0 - if slave is not running. 1 - if slave is running. 2 - if slave NOT configured. | MySQL Replication Status | |
| MySQL_slave_Sql_Running_Status Returns 0 - if slave SQL is not running. 1 - if slave SQL is running. 2 - if slave SQL NOT configured. | MySQL Slave SQL Running Status | |
| MySQL_slave_IO_Running_Status Returns 0 - if slave IO is not running. 1 - if slave IO is running. 2 - if slave IO NOT configured. | MySQL Slave IO Running Status | |
| MySQL_slave_Sql_Running_State The Running state of slave SQL service, returns 1 - if sql state is "Making temporary file (append) before replaying LOAD DATA INFILE". 2 - if sql state is "Making temporary file (create) before replaying LOAD DATA INFILE". 3 - if sql state is "Reading event from the relay log". 4 - if sql state is "Slave has read all relay log; waiting for more updates". 5 - if sql state is "Waiting for an event from Coordinator". 6 - if sql state is "Waiting for slave mutex on exit". 7 - if sql state is "Waiting for Slave Workers to free pending events". 8 - if sql state is "Waiting for the next event in relay log". 9 - if sql state is "Waiting until MASTER_DELAY seconds after master executed event". Note: Not applicable to MySQL v5.6 | MySQL Slave IO State | |
| MySQL.innodb.row.lock.waits Total number of times the InnoDB table operations are kept on hold due to a row lock. | MySQL Innodb Row Lock waits | count |
| MySQL.aborted.clients The number of connected aborted when the client missed to close the connection appropriately. | MySQL Aborted Clients | count |
| MySQL.aborted.connects The number of failed attempts to connect to the MySQL server. | MySQL Aborted Connects | count |
| MySQL.active.transactions Number of active transactions | MySQL Active Transactions | count |
| MySQL.bytes.received The number of bytes received from all clients. | MySQL Bytes Received | bytespersec(bps) |
| MySQL.bytes.sent The number of bytes sent to all clients. | MySQL Bytes Sent | bytespersec(bps) |
| MySQL.connected.threads.count The number of MySQL connected threads. | MySQL Connected Threads count | - |
| MySQL.created.threads The number of threads created to handle connections. | MySQL Created Threads | count |
| MySQL.createdatabase.commands The number of times CREATE DATABASE command is executed | MySQL Createdatabase Commands | persecond(psec) |
| MySQL.createtable.commands The number of times CREATE TABLE command is executed | MySQL CreateTable Commands | persecond(psec) |
| MySQL.createuser.commands The number of times CREATE USER command is executed | MySQL Createuser Commands | persecond(psec) |
| MySQL.delete.commands The number of times Delete command is executed | MySQL Delete Command | persecond(psec) |
| MySQL.disk.temporarytables.created The rate of temporary tables created in seconds. | MySQL Disk Temporary Tables Created | persecond(psec) |
| MySQL.dropdatabase.commands The number of times DROP DATABASE command is executed | MySQL DropDatabase Commands | persecond(psec) |
| MySQL.droptable.commands The number of times DROP TABLE command is executed | MySQL DropTable Command | persecond(psec) |
| MySQL.dropuser.commands The number of times DROP USER command is executed. | MySQL Dropuser Commands | persecond(psec) |
| MySQL.innodb.bufferpool.dirtypages The current number of dirty pages in the InnoDB buffer pool. | MySQL Innodb Bufferpool Dirtypages | count |
| MySQL.innodb.bufferpool.pagesfree The number of free pages in the InnoDB Buffer Pool. | MySQL Innodb Buffer Pool Pages free | count |
| MySQL.innodb.bufferpool.pagestotal The total number of pages in the InnoDB Buffer Pool. | MySQL Innodb Bufferpool Pagestotal | count |
| MySQL.innodb.bufferpool.utilization The utilization of the InnoDB Buffer Pool. | MySQL Innodb Bufferpool Utilization | percentage(%) |
| MySQL.innodb.buffer_pool_reads The number of logical reads that InnoDB reads directly from the disk and not from the buffer pool. | MySQL Innodb Bufferpool Reads | count |
| MySQL.innodb.buffer_pool_read_requests The number of reads added to the InnoDB buffer pool. | MySQL Innodb Bufferpool Read Requests | count |
| MySQL.innodb.buffer_pool_write_requests The number of writes added to the InnoDB buffer pool. | MySQL Innodb Bufferpool Write Requests | count |
| MySQL.innodb.data.pending.reads The current number of pending reads. | MySQL Innodb Data Pending Reads | count |
| MySQL.innodb.data.pending.writes The total number of data writes. | MySQL Innodb Data Pending Writes | count |
| MySQL.innodb.data.reads The total number of data reads (OS file reads). | MySQL Innodb Data Reads | count |
| MySQL.innodb.data.writes The total number of data writes. | MySQL InnoDB Data Writes | count |
| MySQL.innodb.row.lock.time The total time spent in acquiring row locks for InnoDB tables in milliseconds. | MySQL Innodb Row Lock Time | milliseconds (ms) |
| MySQL.innodb.row.lock.waits The number of times operations on InnoDB tables waits for a row lock. | MySQL Innodb Row Lock Waits | count |
| MySQL.insert.commands The number of times Insert command is executed. | MySQL Insert Command | persecond(psec) |
| MySQL.internal.connection.errors The number of connections rejected due to internal errors in the server such as failure to start a new thread or an out-of-memory condition. | MySQL Internal Connection Errors | count |
| MySQL.max.connections.connection_errors The number of connections rejected due to internal server errors. | MySQL Max Connections Connection Errors | count |
| MySQL.open.files function cannot be counted. | MySQL Open Files | count |
| MySQL.open.tables The number of tables opened with my_open(). | MySQL Open Tables | count |
| MySQL.performance.table_locks_immediate The number of times a table lock request is granted immediately. | MySQL Performance Table Locks Immediate | count |
| MySQL.rollback.commands The number of times RollBack command is executed | MySQL Rollback Command | persecond(psec) |
| MySQL.running.threads The number of threads that are not sleeping. | MySQL Running Threads | count |
| MySQL.select.commands The number of times SELECT command is executed. | MySQL Select Command | persecond(psec) |
| MySQL.server.connections The number of connection attempts to the MySQL server. | MySQL Server Connections | count |
| MySQL.slow.queries The total number of slow queries that exceeded the long_query_time. | MySQL Slow Queries | |
| MySQL.ssl.client.connects The number of SSL connection attempts to an SSL-enabled master. | MySQL SSL Client Connects | count |
| MySQL.streams.open The number of streams that are open (used mainly for logging). | MySQL Streams Open | count |
| MySQL.table.locks_immediate The number of times a table lock request is granted immediately. | MySQL Table Locks Immediate | count |
| MySQL.temporary.files.created The rate of temporary files created in seconds. | MySQL Temporary Files Created | persecond(psec) |
| MySQL.threads.created The number of threads created to handle connections. Increase the thread_cache_size value, when the Threads_created increases. | MySQL Threads Created | count |
| MySQL.threads.stacksize The stack size for each thread. Majority of the limits detected by the crash-me test are dependent on this value. | MySQL Threads Stacksize | - |
| MySQL.update.commands The number of times UPDATE command is executed. | MySQL Update Commands | persecond (psec) |