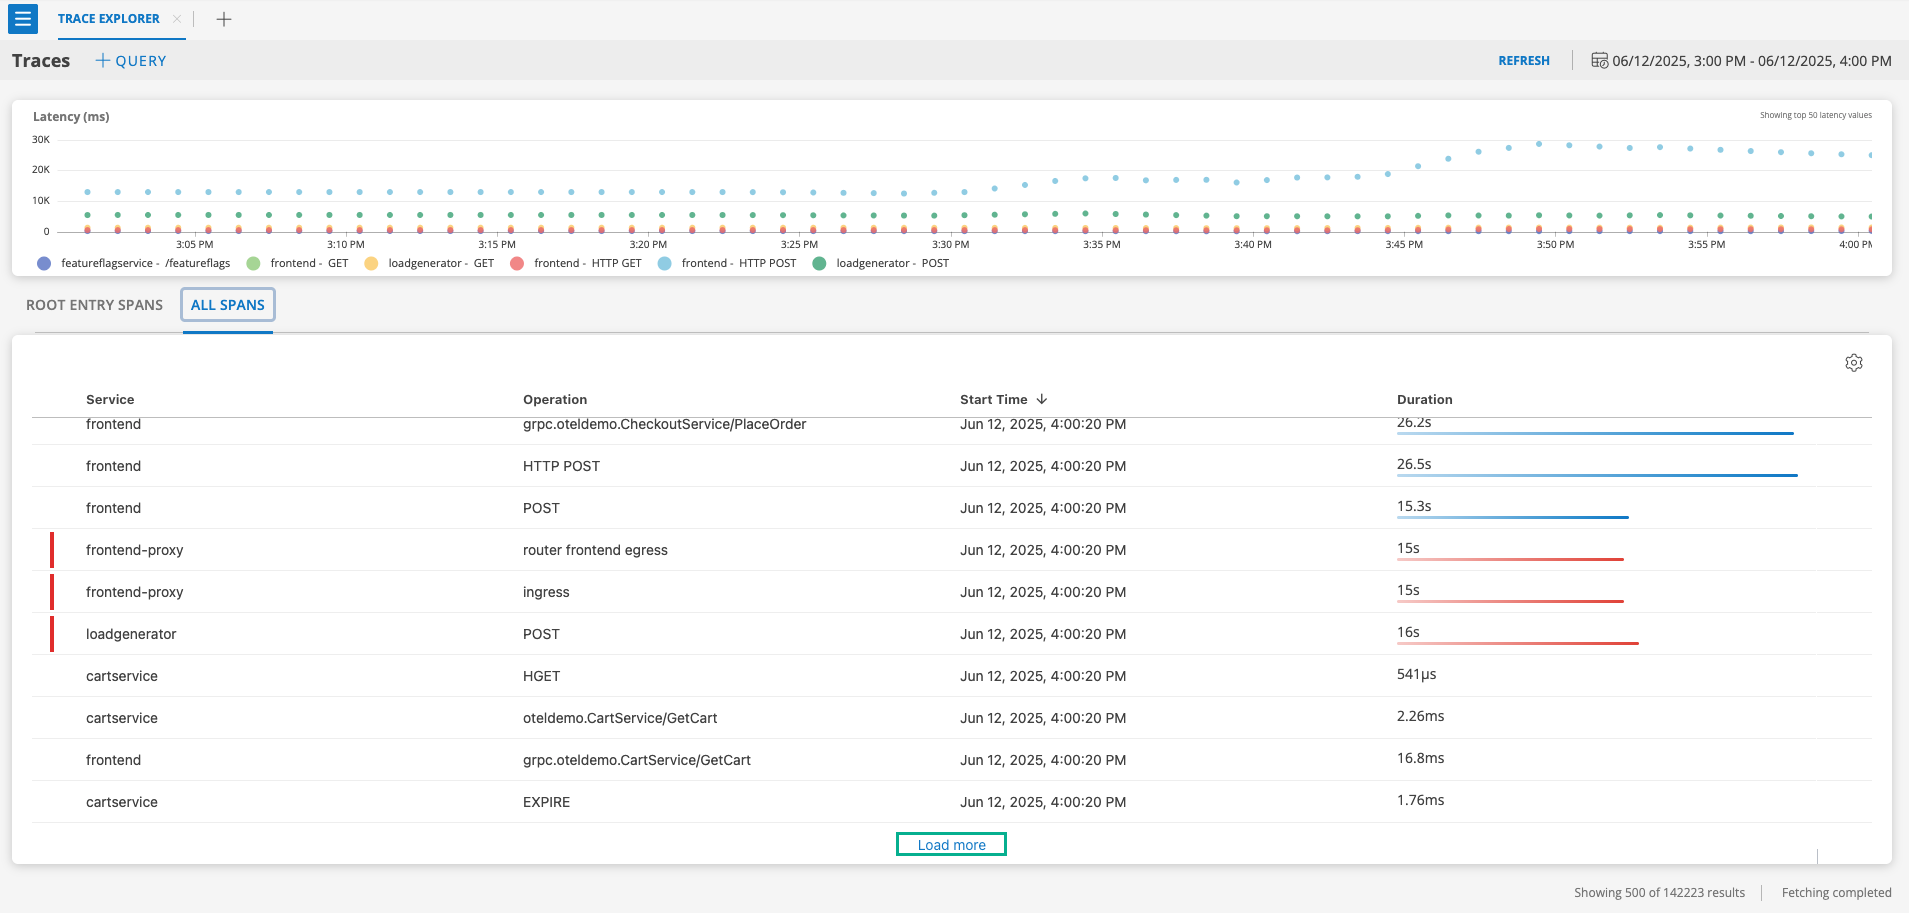
The TRACES EXPLORER page typically provides a summary or aggregated view of traces within a system or application. Traces refer to a sequence of recorded events or transactions that occur during the execution of a service.
The TRACES EXPLORER page is designed to offer a high-level perspective on the performance, behavior, and interactions captured in the traces. It may include key metrics such as:
- Latency: The time it takes for a request to be processed from initiation to completion.
- Error Rates: The count of traced transactions that resulted in errors or exceptions.
- Spans Count: The span count refers to the number of individual spans recorded within a trace.
- Service Count: The service count refers to the number of distinct services or that are involved in the processing of a distributed trace.
To view the details:
Navigate to Infrastructure > Traces.
By default, the Services page will be displayed.
Click the Menu icon and select Trace Explorer to view explorer page.The Trace Explorer page displays TRACES, ROOT ENTRY SPANS, and ALL SPANS.
- The graph shows average latency of the top 50 operations in the time frame selected.
- Root Entry Spans shows latest 1000 spans matching the filter criteria. The Root Entry Spans list includes a Trace Duration field that displays the total duration of a trace including synchronous and asynchronous operations.
- ALL Spans shows latest 500 spans matching the filter criteria. Click Load more to see more spans.
Note
Select Load more to view 500 additional spans. To fetch more entries, adjust the time frame.


Note
You can sort the fields for both Root Entry Spans and All Spans after the data is loaded.Select a span from the list to open the side panel which shows the span details. Click View related logs to access the logs page for the selected span.

To view detailed information of each span, click the three-dot icon adjacent to a span.
Click View details.The details page is displayed with hierarchical representation of each span. This page include a Total Duration field that displays the complete execution time of a trace.
Note
You can view Total Duration in the TIMELINE and LATENCY sections. The Total Duration is not available in SERVICE MAPS.
The span details page shows information about the service the span belongs to, operation details, and other attribute details.
Click the ⚙️ icon to add custom columns.

- Save the view of the page after custom columns are added.


Column Settings
You can add or remove a column in the TRACE EXPLORER page.
Follow these steps to add or remove a column:
Click the Settings icon on the TRACE EXPLORER page.

Select a check box to add a column. Clear a check box to remove a column.
Click Update.The table will be updated accordingly.
View Latency
A latency pie chart typically represents the distribution of latency or response time for the operation of a service. The latency pie chart breaks down the total response time into segments corresponding to different operations within the service. Each segment of the pie chart represents the time spent in a specific part of the application.

Fast Calls
When analyzing the performance of an application, the trace details often include information about individual operations or components that contribute to the overall latency of a request. The fast calls refer to those parts of the system that have low latency and execute quickly, and their identification is crucial for efficient performance optimization.
To enhance the user experience, any fast calls with negligible latency (less than 0.10% when compared to total trace latency) present in the trace should be minimized when the user clicks on trace details.

Navigate to Kubernetes (K8s) resources
You can directly navigate to the specific Kubernetes (K8s) resource that generated a trace from trace details page. This enhancement provides quick access to relevant resources for efficient troubleshooting.
Note
Prerequisite: The Kubernetes 2.0 agent must be installed on the client.To navigate to K8s resource:
On the trace explorer, click on a trace entry to open the trace details page.
On the trace details page, locate the Kubernetes resource link under RELATED RESOURCES section.

Click the hyperlink to directly open the corresponding K8s resource.