Introduction
Service Insights 2.0 page is an enhancement of the Service page within the user interface. Previously, the Service overview page only included the Operations tab for viewing basic service operations.
The service metrics like Latency, Error rate, Throughput, and Apdex Score remains same in both Service page and Services 2.0.
For more information on navigating to Services page and Operations tab see, the Services page.
Prerequisite
The Kubernetes 2.0 agent must be installed on the client.Detailed overview of tabs and functionalities
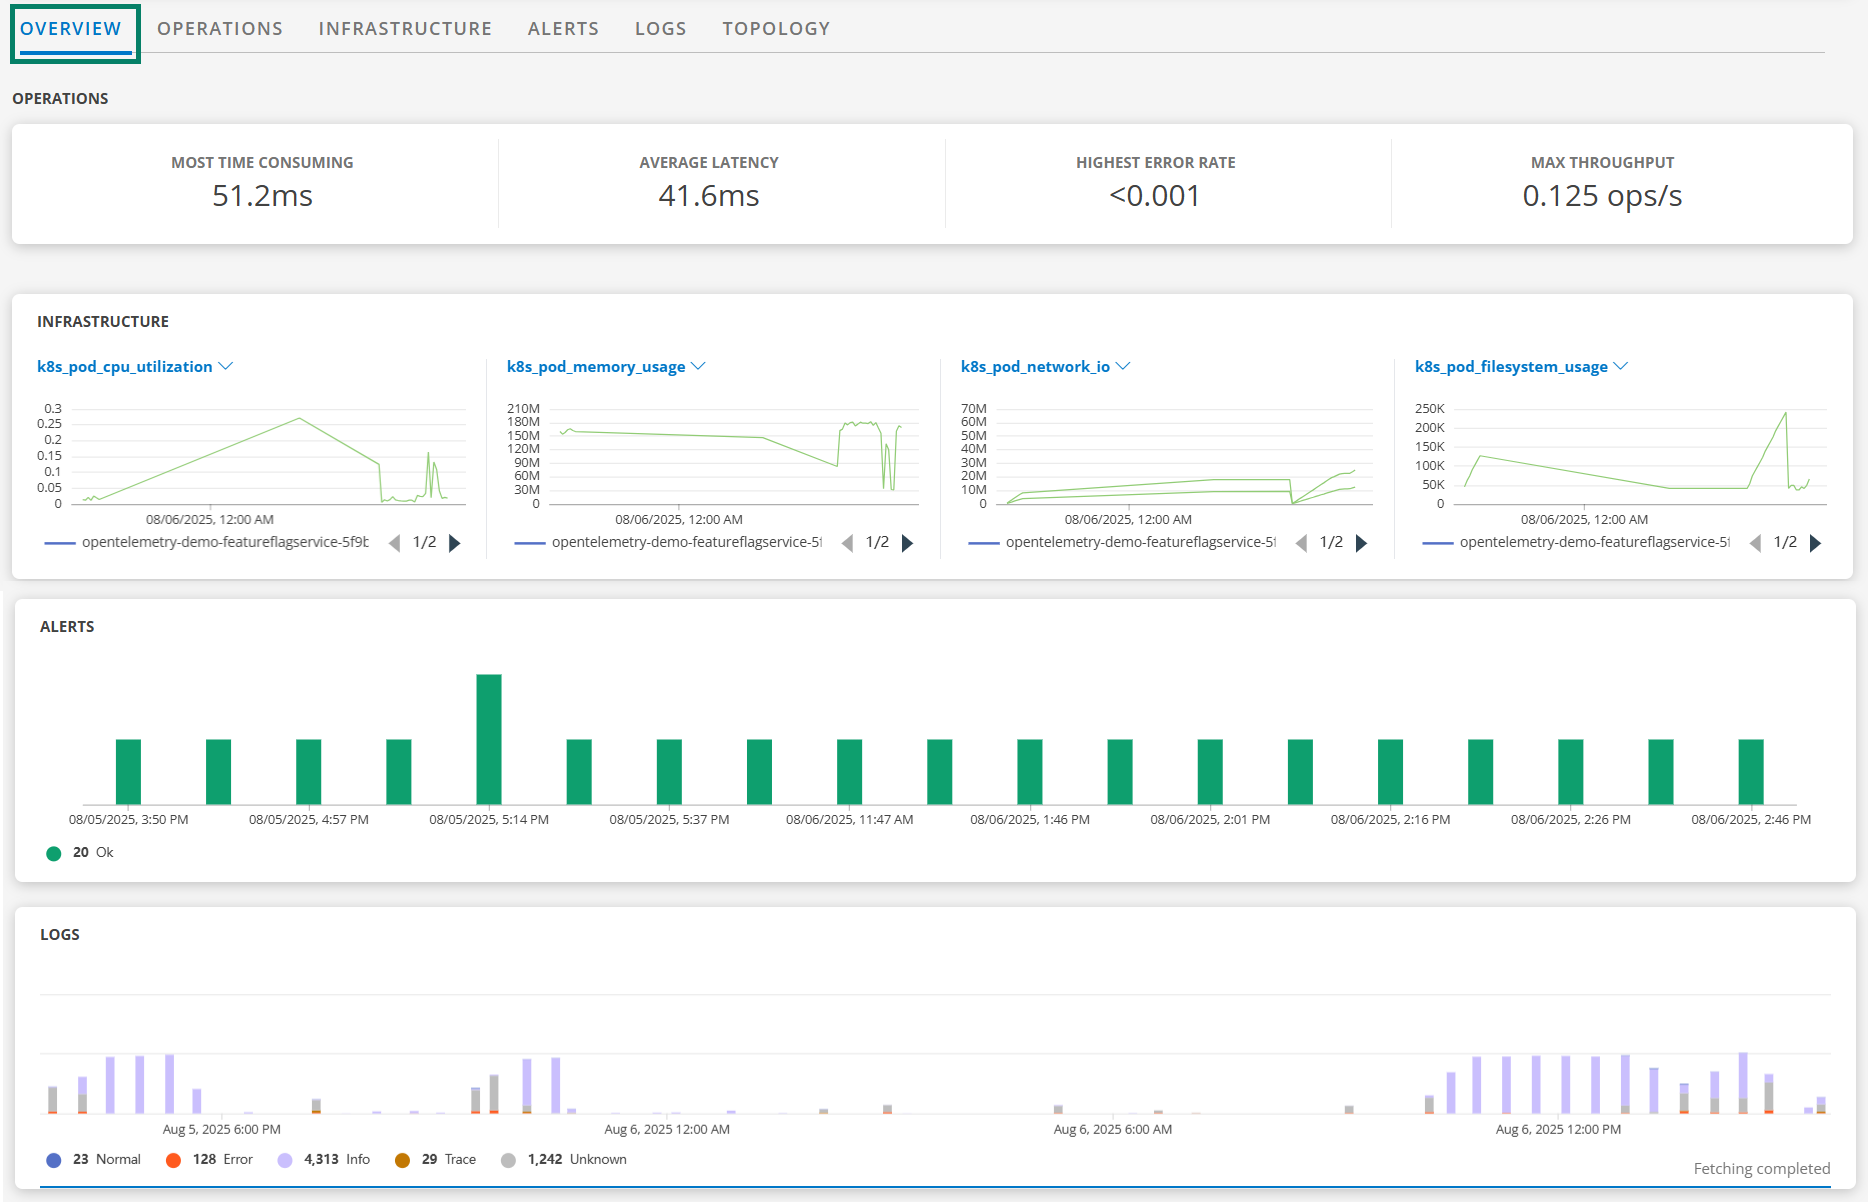
Overview Tab
The Overview tab displays widgets from multiple tabs, including Operations, Infrastructure, Alerts, and Logs.
Infrastructure Tab
The Infrastructure tab provides detailed insights into key resource metrics. The following are the details of displayed data.
- CPU Utilization: Displays the percentage of CPU usage over time, that allows user to monitor how the CPU resources are being utilized.
- Memory Usage: Tracks the consumption of system memory.
- Network Usage: Provides data on network activity.
- Filesystem Usage: Shows detailed information about disk space usage.

Alerts Tab
The Alerts tab provides details of alerts configured for resources associated with the selected service. Users can define their own alert rules and criteria, allowing the system to generate alerts based on specified conditions. the timeline graph includes clickable tiles that take users to the Alerts Explorer, where alerts related to the selected service are displayed with the necessary filters and timestamps.

Logs Tab
The Logs tab provides the logs of pods associated with the selected service. This enhancement links tracing data with resource information. These logs are aligned with the resources shown in the topology tab. Click any tile in the timeline graph to view all logs related to the selected service in the Logs Explorer, with filters and timestamps.

Topology Tab
The Topology tab provides a map representation of all resources associated with the selected service. The tab displays the hierarchy of resources, including deployments names, replica sets, pod details.
Users can click on any node within the topology to see the additional details, such as resource descriptions, owner names, and alias names.

Addition of filter to service overview page
A new filter Infrastructure is added to the trace service overview page for Kubernetes 2.0 environments. The filter value is derived using the following pattern:
<k8s.cluster.name>_<k8s.namespace.name>_<One of the below list available>
- k8s.deployment.name
- k8s.replicaset.name
- k8s.statefulset.name
- k8s.daemonset.name
- k8s.cronjob.name
- k8s.job.name
By default, the value is selected as All.

Application name visibility
Users can now view the application name and service name on the User Interface (UI). The application name from which the user entered the service is displayed at the top-right corner of the services page. If no application name is defined in the tracing proxy configuration, the system assigns a default name. Users can modify application names through configuration.
