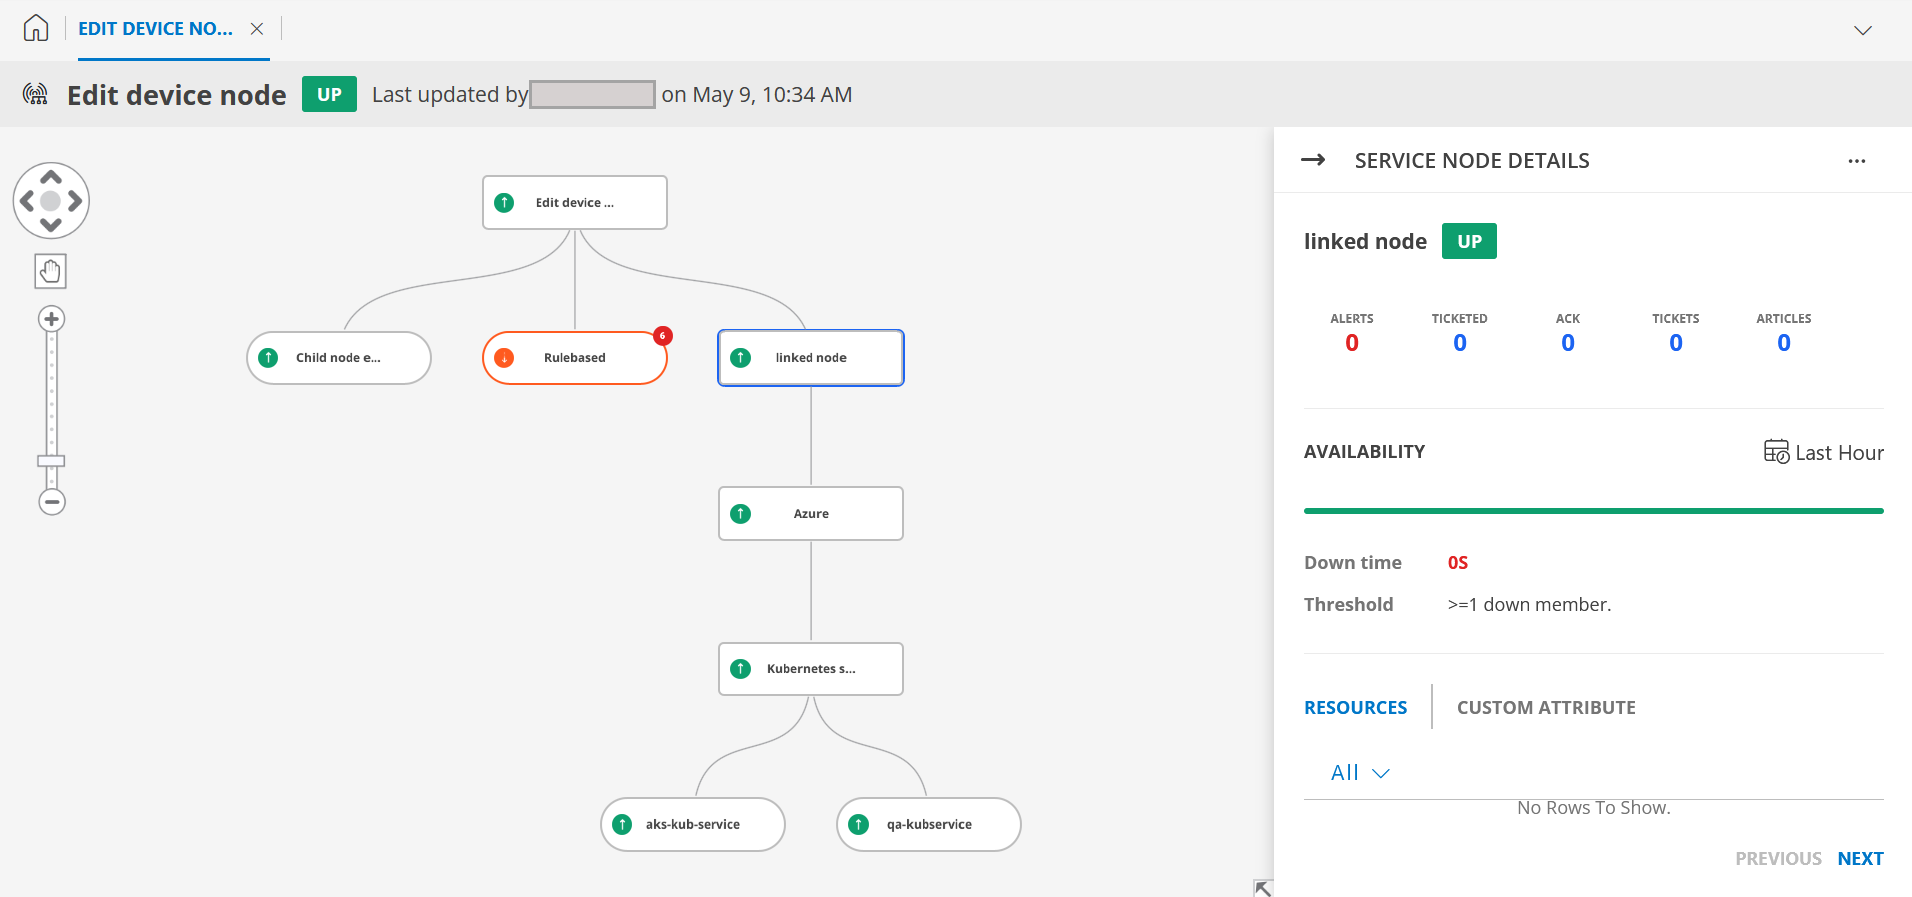
The node details screen provides an in-depth view of a selected service node within a Service Map. It helps users monitor and manage the health, availability, and performance of a node and its associated resources. This screen consolidates all relevant data, enabling faster troubleshooting and decision-making.
Access View Details
To navigate to this screen:
- Go to Infrastructure > Service Maps.
- Select a Service Map from the listing page.
- In the slide-out panel, click the View Details button for a specific service node.
The detailed view screen opens, displaying information about the node, its dependencies, and its associated resources.

Elements of View Details
| Element | Description |
|---|---|
| Node Name and Status | Displays the name of the selected service node and its current health status (e.g., UP, Down, or Degraded). |
| Hierarchical Visualization | Provides a hierarchical view of the parent node and its dependent child nodes, representing relationships and dependencies:
|
| Details slide-out | Displays real-time availability information for the node:
|
| Resources | A list of resources linked to the selected node. For each resource:
|
| Custom Attributes | Displays any custom attributes configured for the node, offering additional metadata for resource categorization and analysis. |