Objective
Ensure the availability and performance of the Acme Web Application, a critical service for business operations, by identifying dependencies, pinpointing root causes of downtime, and using OpsRamp Service Maps to streamline resolution.
Scenario
During a high-traffic period, the Acme Web Application goes down unexpectedly. Users report connectivity issues, and monitoring tools generate multiple alerts. The application comprises:
- A Load Balancer to manage incoming traffic.
- Multiple Application Servers to process requests.
- Database Servers for data storage and management. The downtime causes significant business disruption, and quick resolution is paramount.
Challenges
- Is the web application available to users?
- Which component is causing the issue if the service is unavailable?
- What percentage of time was the application available?
- How much downtime is attributable to each component?

Solution
OpsRamp Service Maps provide an intuitive way to address these challenges. Here’s how you can build and use a Service Map to monitor and resolve the issue effectively:
- Create the Service Map
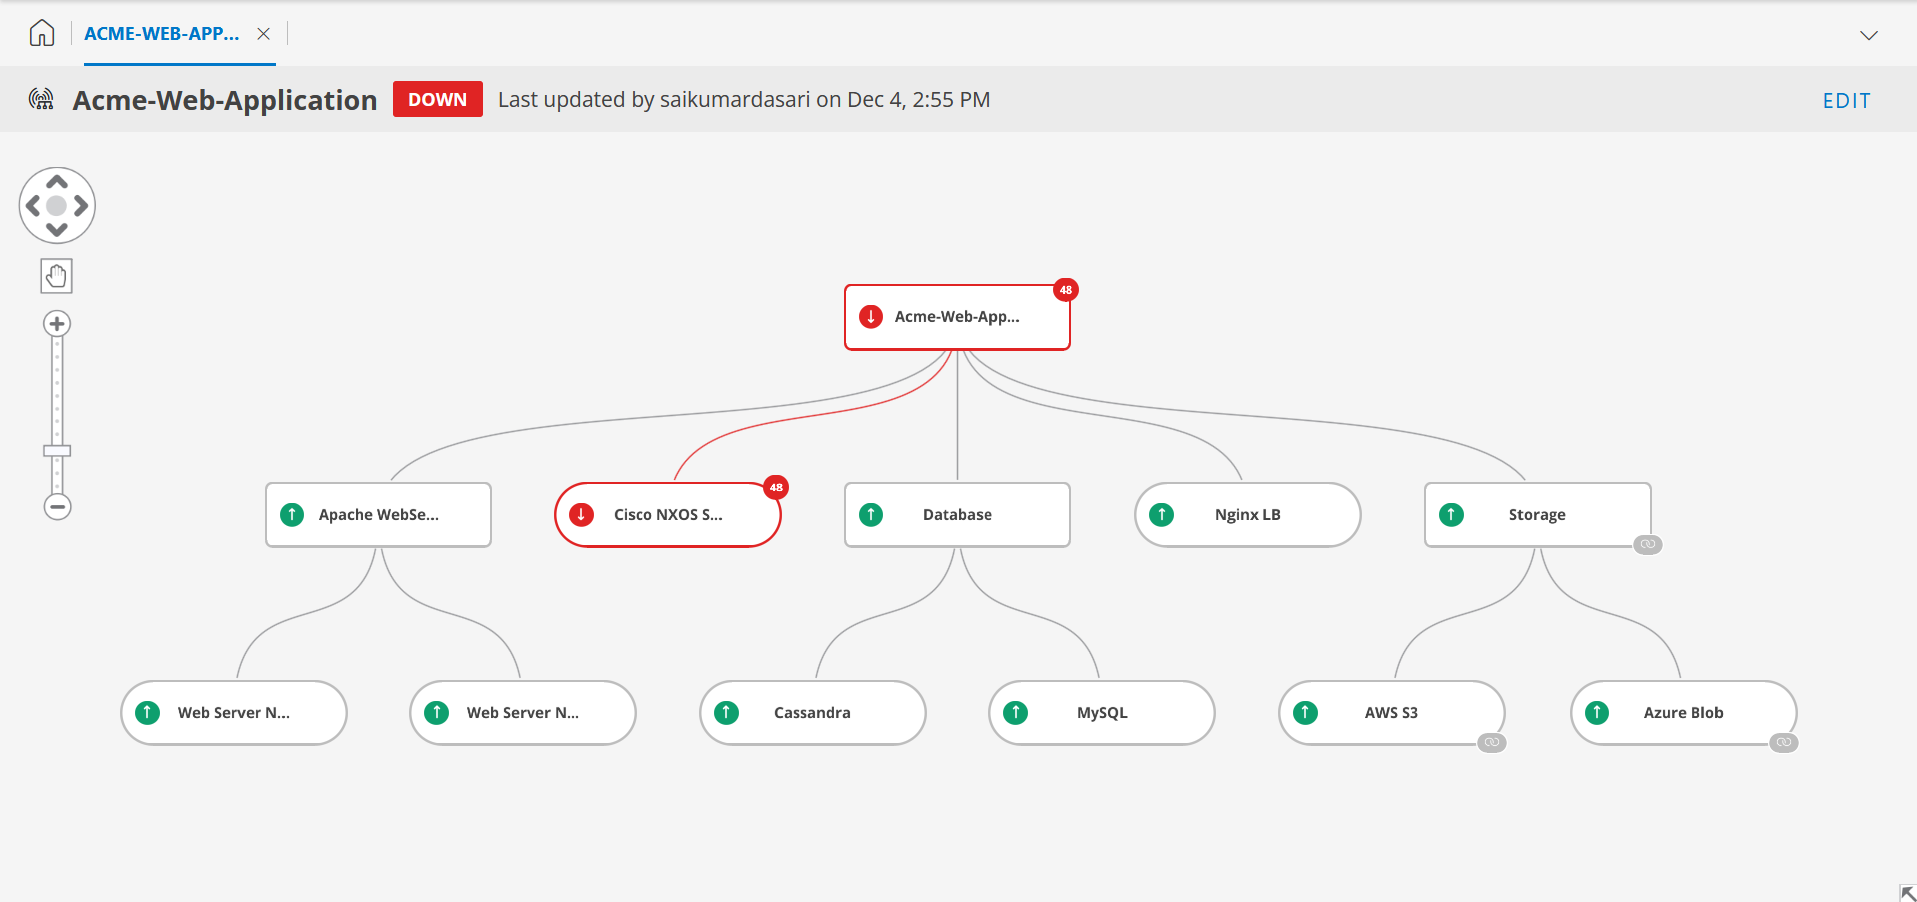
- Configure your main Service node - Acme Web Application to represent the entire service.
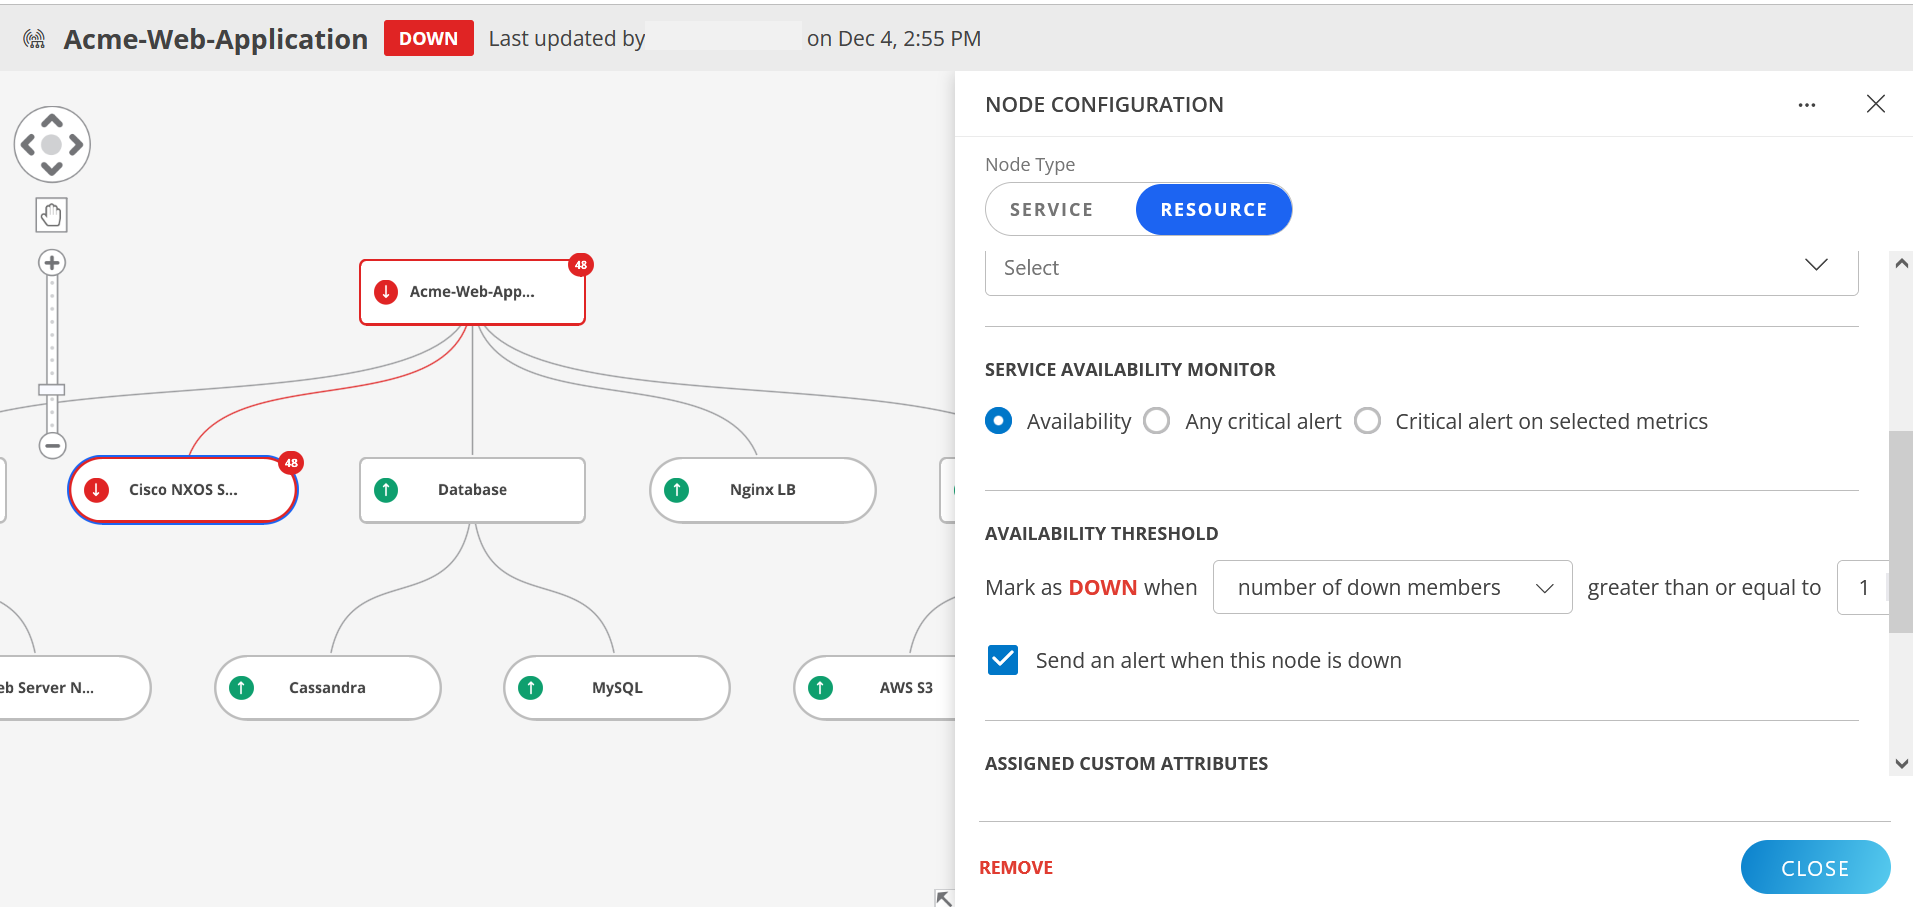
- Configure its availability thresholds and enable alerts to track downtime.
- Configure Resource nodes. In this use case:
- Apache Web Server is a Service node to manage the multiple resources. So, add this as a service node.
- Cisco NXOS Switch is a networking component. Add as resource node .
- Storage Service Map is an existing map linked to the current service map to monitor dynamic updates.
- Database Service Map is also created separately. However, it is imported to the current Service Map as a static copy.
- Monitor in Real-Time
- Green Nodes: Indicates components are operational.
- Red Nodes: Highlights failures, such as the Cisco NXOS Switch, causing the service to be down.
- Orange Nodes: Indicates degraded performance, and this is caused by underlying nodes.
- Drill Down for Root Cause
- Open the Resource node details panel for the Cisco NXOS Switch:
- Review Alerts to confirm it as the root cause.
- Assess downstream impact on connected nodes.
- Open the Resource node details panel for the Cisco NXOS Switch:
- Take Corrective Actions
- Redistribute traffic to operational components.
- Edit threshold levels , if required.
- Allocate additional resources to handle the load.
- Resolve the failing switch issue and validate recovery.

Outcome
Using Service Maps, your team:
- Identifies the failing Cisco NXOS Switch as the root cause within minutes.
- Implements corrective actions, restoring service quickly.
- Gains actionable insights for future optimization and scalability.