Introduction
VMware NSX Advanced Load Balancer (formerly AVI Networks) simplifies load balancing, web application firewall, and container ingress for any application across data centers and clouds.
- Multi-Cloud Consistency: Centralized policies ensure operational consistency and ease of administration.
- Pervasive Analytics: Gain valuable insights into application performance and security through comprehensive monitoring.
- Full Lifecycle Automation: Automate application delivery to free teams from manual tasks.
- Future Proof: Seamlessly extend application services to cloud-native and containerized applications.
NSX Advanced Load Balancer with Cloud Services offers multi-cloud load balancing, web application firewall, application analytics, and container services with SaaS-based operations. It can be deployed on-premises and in the cloud, consisting of three main components:
- Software Control Plane (NSX Advanced Load Balancer Controller): Responsible for Service Engines placement, automation, analytics, and resiliency.
- Software Data Plane (NSX Advanced Load Balancer Service Engine): Provides local and global load balancing, application security, container ingress services, IPAM, and DNS functionality.
- Cloud Services (NSX Advanced Load Balancer Cloud Services): Offers SaaS capabilities to simplify operations and enhance security for workloads.
Key Use Cases
Discovery Use Cases
- It discovers VMware NSX Advanced Load Balancer components like GSLB, Service Engine, AVI Cloud, Virtual Services and Pools.
- Publishes relationships between resources to have topological view and ease of maintenance.
Monitoring Use Cases
The device monitoring helps to collect the metric values with respect to time and sends alerts to the intended customer team to act up immediately in case of any threshold breach or unexpected metric behavior observed based on configurations. In a way it helps the customer with smooth functioning of business with minimal or zero downtime in case of any infrastructure related issues occurring.
Prerequisites
- OpsRamp Classic Gateway(Linux) 14.0.0 and above.
- OpsRamp NextGen Gateway 14.0.0 and above.
Note: OpsRamp recommends using the latest Gateway version for full coverage of recent bug fixes, enhancements, etc.
Supported Target Version
- X-Avi-Veersion : 21.1.3, 22.x.x
Resource Hierarchy
VMware NSX Advanced Load Balancer(AVI EndPoint)
→ GLSB
→ Virtual Service
→ Pool
→ Service Engine
→ AVICloud
Supported Metrics
Click here to view the supported metrics
| Native Type | Metric Name | Display Name | Metric Label | Units | Application Version | Description |
|---|---|---|---|---|---|---|
| VMware NSX Advanced Load Balancer | vmwarensx_loadbalancer_APIStatistics | VMware NSX Load Balancer API Statistics | Usage | 1.0.0 | Provides the number of api calls made to the target within the frequency and resources | |
| vmwarensx_loadbalancer_albservice_ConnectivityStatus | ALBService Connectivity Status | Availability | 1.0.0 | Returns ALBService Connectivity Status on AVI EndPoint.Possible states are ALBSERVICES_DISCONNECTED(0), ALBSERVICES_CONNECTED(1) | ||
| AVI Service Engine | vmwarensx_loadbalancer_serviceengine_RunTimeOperStatus | Service Engine Run Time Operating Status | Availability | 1.0.0 | Returns Service Engine Run Time Operating Status.Possible states are OPER_UP(0), OPER_DOWN(1), OPER_CREATING(2), OPER_RESOURCES(3), OPER_INACTIVE(4), OPER_DISABLED(5), OPER_UNUSED(6), OPER_UNKNOWN(7), OPER_PROCESSING(8), OPER_INITIALIZING(9), OPER_ERROR_DISABLED(10), OPER_AWAIT_MANUAL_PLACEMENT(11), OPER_UPGRADING(12), OPER_SE_PROCESSING(13), OPER_PARTITIONED(14), OPER_DISABLING(15), OPER_FAILED(16), OPER_UNAVAIL(17), OPER_AGGREGATE_DOWN(18) | |
| vmwarensx_loadbalancer_serviceengine_HealthScore | Service Engine Health Score | Performance | % | 1.0.0 | Service Engine Health Score | |
| vmwarensx_loadbalancer_serviceengine_SeIfAvgBandWidth | Service Engine Average BandWidth | Performance | bps | 1.0.0 | Service Engine Average BandWidth | |
| vmwarensx_loadbalancer_serviceengine_AvgCpuUsageStats | Service Engine Average Cpu Usage | Usage | % | 1.0.0 | Service Engine Average Cpu Usage | |
| vmwarensx_loadbalancer_serviceengine_AvgMemUsageStats | Service Engine Average Memory Usage | Usage | % | 1.0.0 | Service Engine Average Memory Usage | |
| AVI Cloud | vmwarensx_loadbalancer_avicloud_Status | AVI Cloud Status | Availability | 1.0.0 | Returns AVI Cloud Status.Possible states are CLOUD_STATE_UNKNOWN(0), CLOUD_STATE_PLACEMENT_READY(1), CLOUD_STATE_IN_PROGRESS(2), CLOUD_STATE_FAILED(3), CLOUD_STATE_DELETING(4), CLOUD_STATE_NOT_CONNECTED(5) | |
| AVI Global Server Load Balancer | vmwarensx_loadbalancer_gslbservice_RunTimeOperStatus | GSLB Run Time Operating Status | Availability | 1.0.0 | Returns GSLB Run Time Operating Status.Possible states are OPER_UP(0), OPER_DOWN(1), OPER_CREATING(2), OPER_RESOURCES(3), OPER_INACTIVE(4), OPER_DISABLED(5), OPER_UNUSED(6), OPER_UNKNOWN(7), OPER_PROCESSING(8), OPER_INITIALIZING(9), OPER_ERROR_DISABLED(10), OPER_AWAIT_MANUAL_PLACEMENT(11), OPER_UPGRADING(12), OPER_SE_PROCESSING(13), OPER_PARTITIONED(14), OPER_DISABLING(15), OPER_FAILED(16), OPER_UNAVAIL(17), OPER_AGGREGATE_DOWN(18) | |
| AVI Virtual Service | vmwarensx_loadbalancer_virtualservice_RunTimeOperStatus | Virtual Service Run Time Operating Status | Availability | 1.0.0 | Returns Virtual Service Run Time Operating Status. Possible states are OPER_UP(0), OPER_DOWN(1), OPER_CREATING(2), OPER_RESOURCES(3), OPER_INACTIVE(4), OPER_DISABLED(5), OPER_UNUSED(6), OPER_UNKNOWN(7), OPER_PROCESSING(8), OPER_INITIALIZING(9), OPER_ERROR_DISABLED(10), OPER_AWAIT_MANUAL_PLACEMENT(11), OPER_UPGRADING(12), OPER_SE_PROCESSING(13), OPER_PARTITIONED(14), OPER_DISABLING(15), OPER_FAILED(16), OPER_UNAVAIL(17), OPER_AGGREGATE_DOWN(18) | |
| vmwarensx_loadbalancer_virtualservice_HealthScore | Virtual Service Health Score | Availability | % | 1.0.0 | Virtual Service Health Score | |
| vmwarensx_loadbalancer_virtualservice_L4ClientAvgTotalRtt | Virtual Service L4Client Average Total Rtt | Performance | ms | 1.0.0 | Virtual Service L4Client Average Total Rtt | |
| vmwarensx_loadbalancer_virtualservice_L4ClientAvgCompleteConns | Virtual Service L4Client Average Complete Conns | Performance | psec | 1.0.0 | Virtual Service L4Client Average Complete Conns | |
| vmwarensx_loadbalancer_virtualservice_L4ClientMaxOpenConns | Virtual Service L4Client Max Open Conns | Usage | count | 1.0.0 | Virtual Service L4Client Max Open Conns | |
| vmwarensx_loadbalancer_virtualservice_L4ClientAvgBandWidth | Virtual Service L4Client Average BandWidth | Performance | bps | 1.0.0 | Virtual Service L4Client Average BandWidth | |
| vmwarensx_loadbalancer_virtualservice_L7ClientAvgTotalHttpRequests | Virtual Service L7Client Total Http Requests | Usage | psec | 1.0.0 | Virtual Service L7Client Total Http Requests | |
| AVI Servers Pool | vmwarensx_loadbalancer_pool_RunTimeOperStatus | Pool Run Time Operating Status | Availability | 1.0.0 | Returns Pool Run Time Operating Status.Possible states are OPER_UP(0), OPER_DOWN(1), OPER_CREATING(2), OPER_RESOURCES(3), OPER_INACTIVE(4), OPER_DISABLED(5), OPER_UNUSED(6), OPER_UNKNOWN(7), OPER_PROCESSING(8), OPER_INITIALIZING(9), OPER_ERROR_DISABLED(10), OPER_AWAIT_MANUAL_PLACEMENT(11), OPER_UPGRADING(12), OPER_SE_PROCESSING(13), OPER_PARTITIONED(14), OPER_DISABLING(15), OPER_FAILED(16), OPER_UNAVAIL(17), OPER_AGGREGATE_DOWN(18) | |
| vmwarensx_loadbalancer_pool_HealthScore | Pool Service Health Score | Availability | % | 1.0.0 | Pool Service Health Score |
Default Monitoring Configurations
vmware-nsx-advanced-load-balancer has default Global Device Management Policies, Global Templates, Global Monitors and Global Metrics in OpsRamp. You can customize these default monitoring configurations as per your business requirement by cloning respective Global Templates and Global Device Management Policies. It is recommended to clone them before installing the application to avoid noise alerts and data.
Default Global Device Management Policies
You can find the Device Management Policy for each Native Type at Setup > Resources > Device Management Policies. Search with suggested names in global scope:
{appName nativeType - version}Ex: vmware-nsx-advanced-load-balancer VMware NSX Advanced Load Balancer - 1 (i.e, appName = vmware-nsx-advanced-load-balancer, nativeType =VMware NSX Advanced Load Balancer, version = 1)
Default Global Templates
You can find the Global Templates for each Native Type at Setup > Monitoring > Templates. Search with suggested names in global scope. Each template adheres to the following naming convention:
{appName nativeType 'Template' - version}Ex: vmware-nsx-advanced-load-balancer VMware NSX Advanced Load Balancer Template - 1 (i.e, appName = vmware-nsx-advanced-load-balancer , nativeType = VMware NSX Advanced Load Balancer, version = 1)
Default Global Monitors
You can find the Global Monitors for each Native Type at Setup > Monitoring > Monitors. Search with suggested names in global scope. Each Monitors adheres to the following naming convention:
{monitorKey appName nativeType - version}Ex: VMware NSX Advanced Load Balancer Monitor vmware-nsx-advanced-load-balancer VMware NSX Advanced Load Balancer 1 (i.e, monitorKey = VMware NSX Advanced Load Balancer Monitor, appName = vmware-nsx-advanced-load-balancer , nativeType = VMware NSX Advanced Load Balancer 1 , version= 1)
Configure and Install the VMware NSX Advanced Load Balancer Integration
- To select your client, navigate to All Clients, and click the Client/Partner dropdown menu.
Note: You may either type your client’s name in the search bar or select your client from the list. - Navigate to Setup > Account. The Account Details screen is displayed.
- Click Integrations. The Installed Integrations screen is displayed with all the installed applications.
Note: If you do not have any installed applications, you will be navigated to the Available Integrations and Apps page with all the available applications along with the newly created application with the version. - Click + ADD on the Installed Integrations page.
Note: Search for the integration either by entering the name of the integration in the search bar or by selecting the category of the integration from the All Categories dropdown list. - Click ADD in the VMware NSX Advanced Load Balancer application.
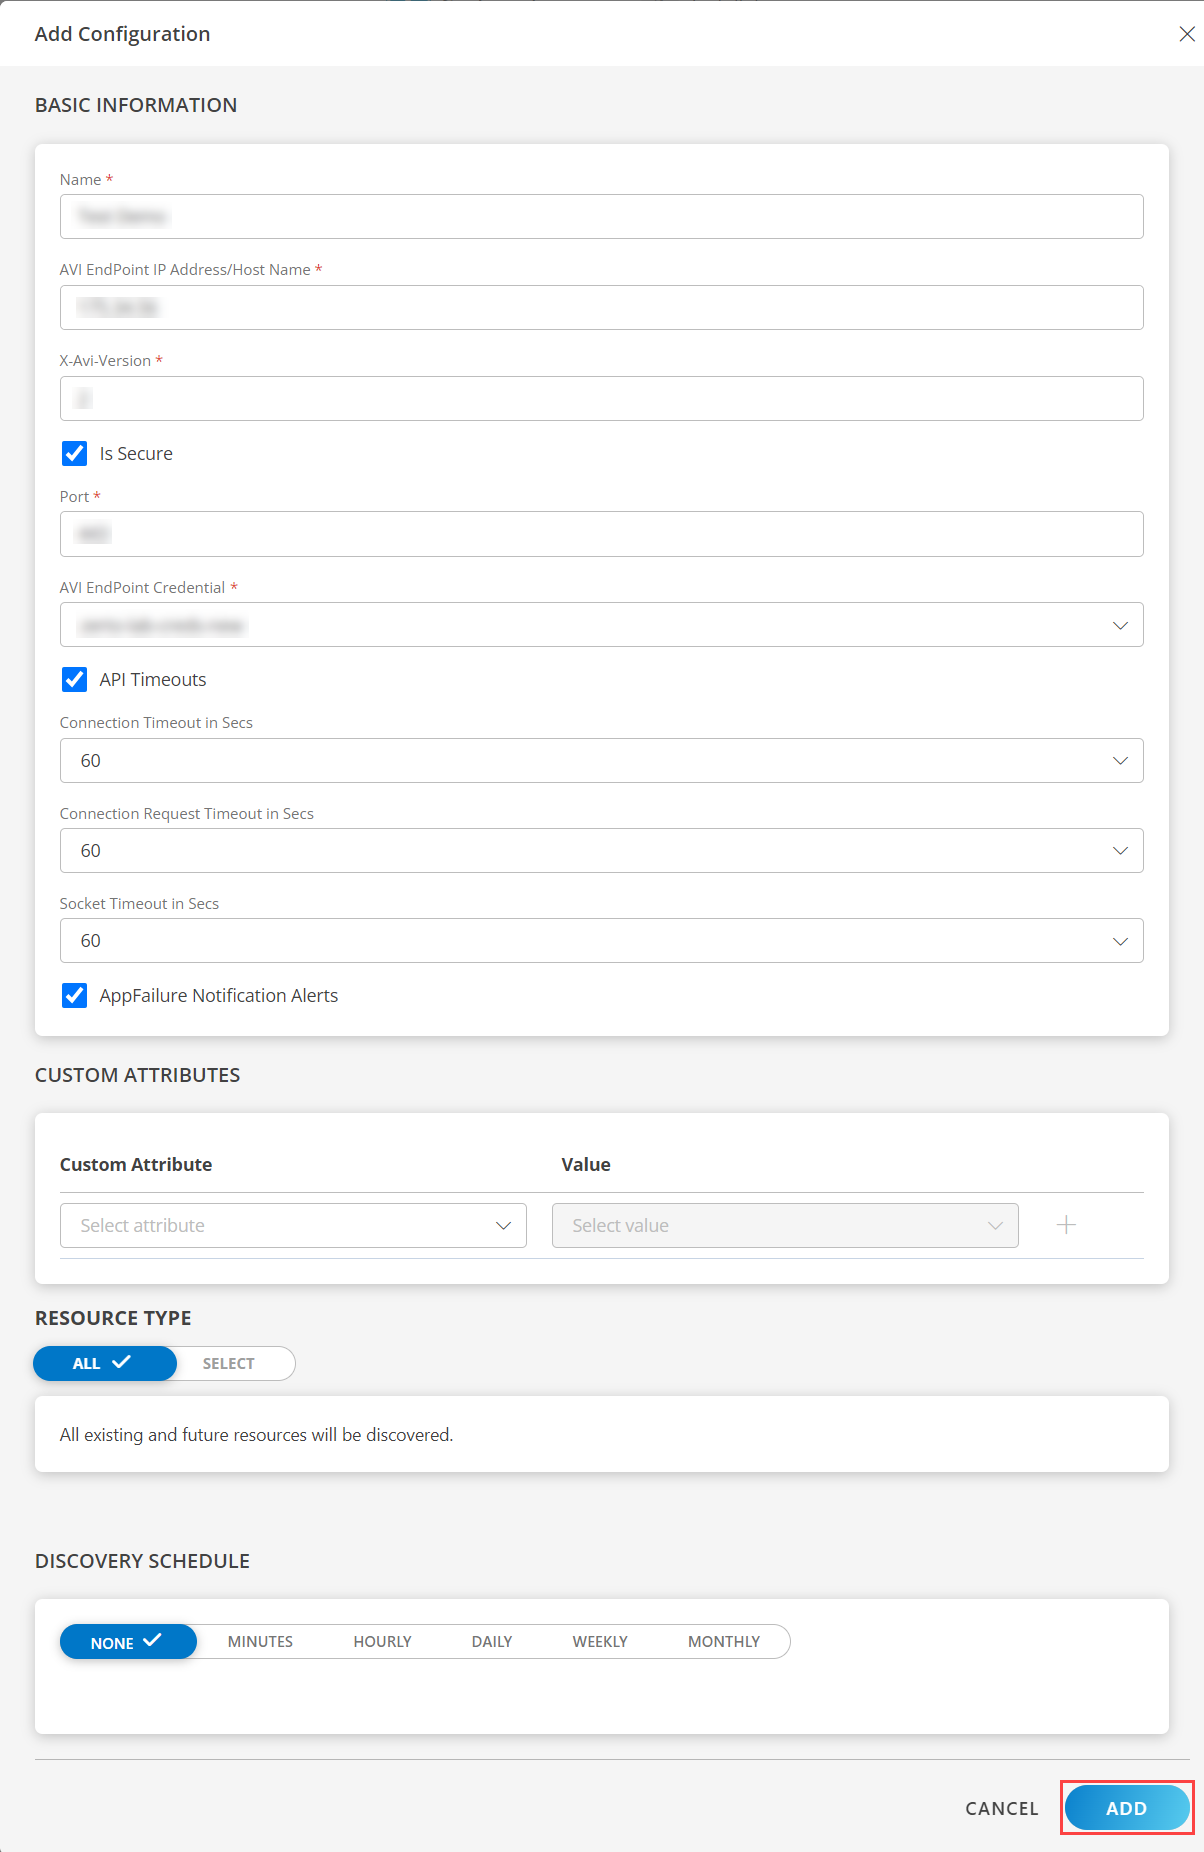
- In the Configuration screen, click + ADD. The Add Configuration screen appears.
- Enter the following BASIC INFORMATION:

| Field Name | Description | Field Type |
|---|---|---|
| Name | Enter the name for the configuration. | String |
| AVI EndPoint IP Address/Host Name | Enter the IP address/host name of the Commvault. It should be accessible from Gateway. | String |
| X-Avi-Version | X-Avi-Version of VMware NSX Advanced Load Balancer | Dropdown |
| Port | Enter the port number to communicate with OpsRamp's endpoints. It should be accessible from Gateway. Default Value: 8080 | Integer |
| Credential | Select the Credential from the drop-down list. Notes:
| Dropdown |
| Is Secure | Select this checkbox if you want the communication between your system and the specified endpoint to be secured using protocols such as HTTPS (HTTP over SSL/TLS). Default Selection: When selected, it signifies that the connection is encrypted, providing an added layer of security to the data being transmitted. | Checkbox |
| API Timeouts | When selected, this checkbox allows you to configure timeout settings for API requests made by the integration to the OpsRamp platform. | Checkbox |
| Connection Timeout in Secs | Select the maximum time, in seconds, that the integration must wait while establishing a connection with the OpsRamp API endpoint. Default Value: 60 | Dropdown |
| Connection Request Timeout in Secs | Select the maximum time, in seconds, required to process an HTTP call: from sending a request to receiving a response. Default Value: 10 | Dropdown |
| Socket Timeout in Secs | Select the maximum time of inactivity between two data packets when exchanging data with a server. Default Value: 10 | Dropdown |
| App Notification Notifications | When selected, you will be notified in case of an application failure that is, Connectivity Exception, Authentication Exception. | Checkbox |
- CUSTOM ATTRIBUTES: Custom attributes are the user-defined data fields or properties that can be added to the preexisting attributes to configure the integration.
| Field Name | Description | Field Type |
|---|---|---|
| Custom Attribute | Select the custom attribute from the dropdown. You can add attributes by clicking the Add icon (+). | Dropdown |
| Value | Select the value from the dropdown. | Dropdown |
Note: The custom attribute that you add here will be assigned to all the resources that are created by the integration. You can add a maximum of five custom attributes (key and value pair).
- In the RESOURCE TYPE section, select:
- ALL: All the existing and future resources will be discovered.
- SELECT: You can select one or multiple resources to be discovered.
- In the DISCOVERY SCHEDULE section, select recurrence pattern to add one of the following patterns:
- Minutes
- Hourly
- Daily
- Weekly
- Monthly
- Click ADD.

Now the configuration is saved and displayed on the configurations page after you save it.Note: From the same page, you may Edit and Remove the created configuration.
12. Under the ADVANCED SETTINGS, Select the Bypass Resource Reconciliation option, if you wish to bypass resource reconciliation when encountering the same resources discovered by multiple applications.
Note: If two different applications provide identical discovery attributes, two separate resources will be generated with those respective attributes from the individual discoveries.
13. Click NEXT.
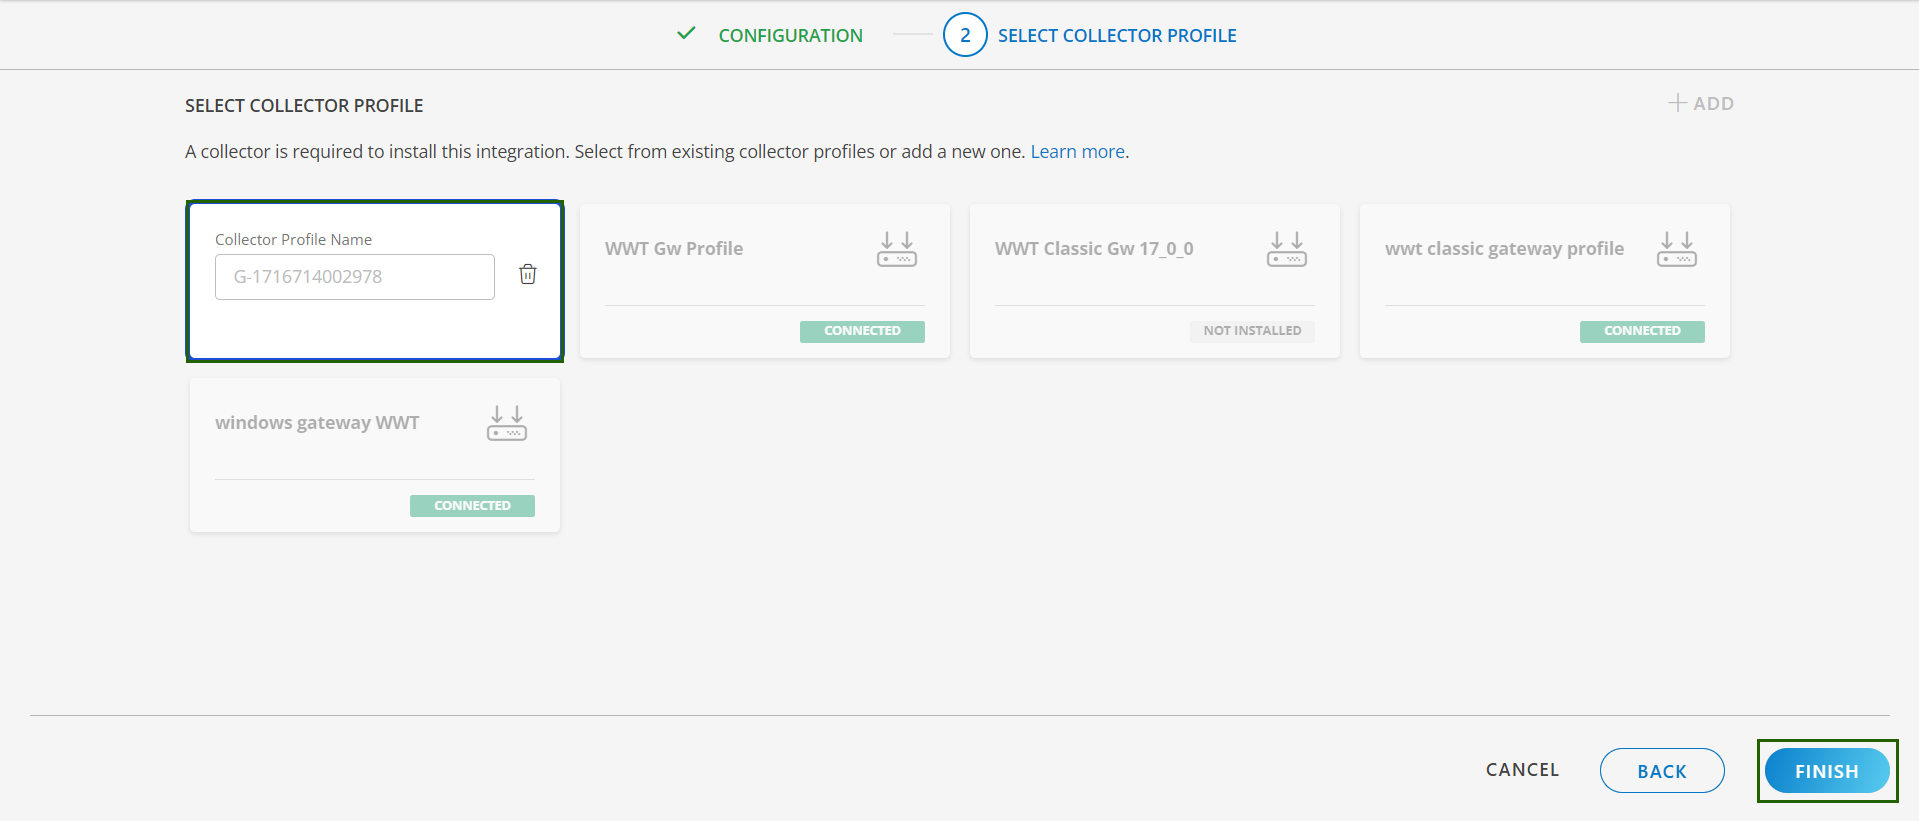
14. (Optional) Click +ADD to create a new collector. You can either use the pre-populated name or give the name to your collector.
15. Select an existing registered profile.

- Click FINISH.
The integration is installed and displayed on the INSTALLED INTEGRATION page. Use the search field to find the installed integration.
Modify the Configuration
See Modify an Installed Integration or Application article.
Note: Select the VMware NSX Advanced Load Balancer application.
View the VMware NSX Advanced Load Balancer details
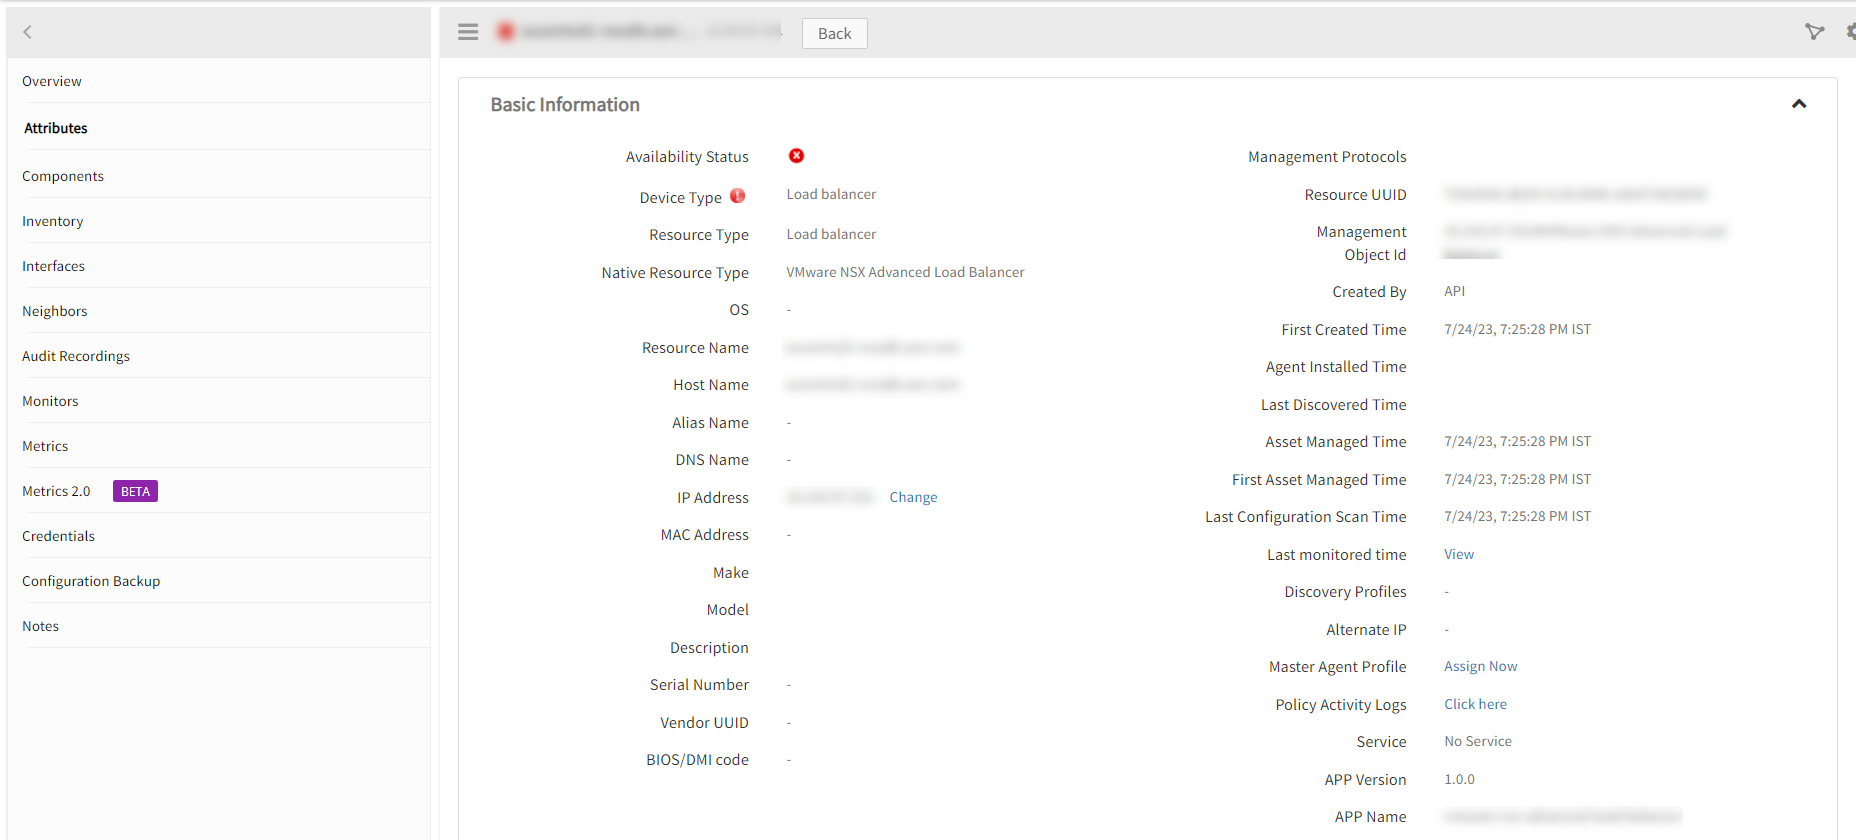
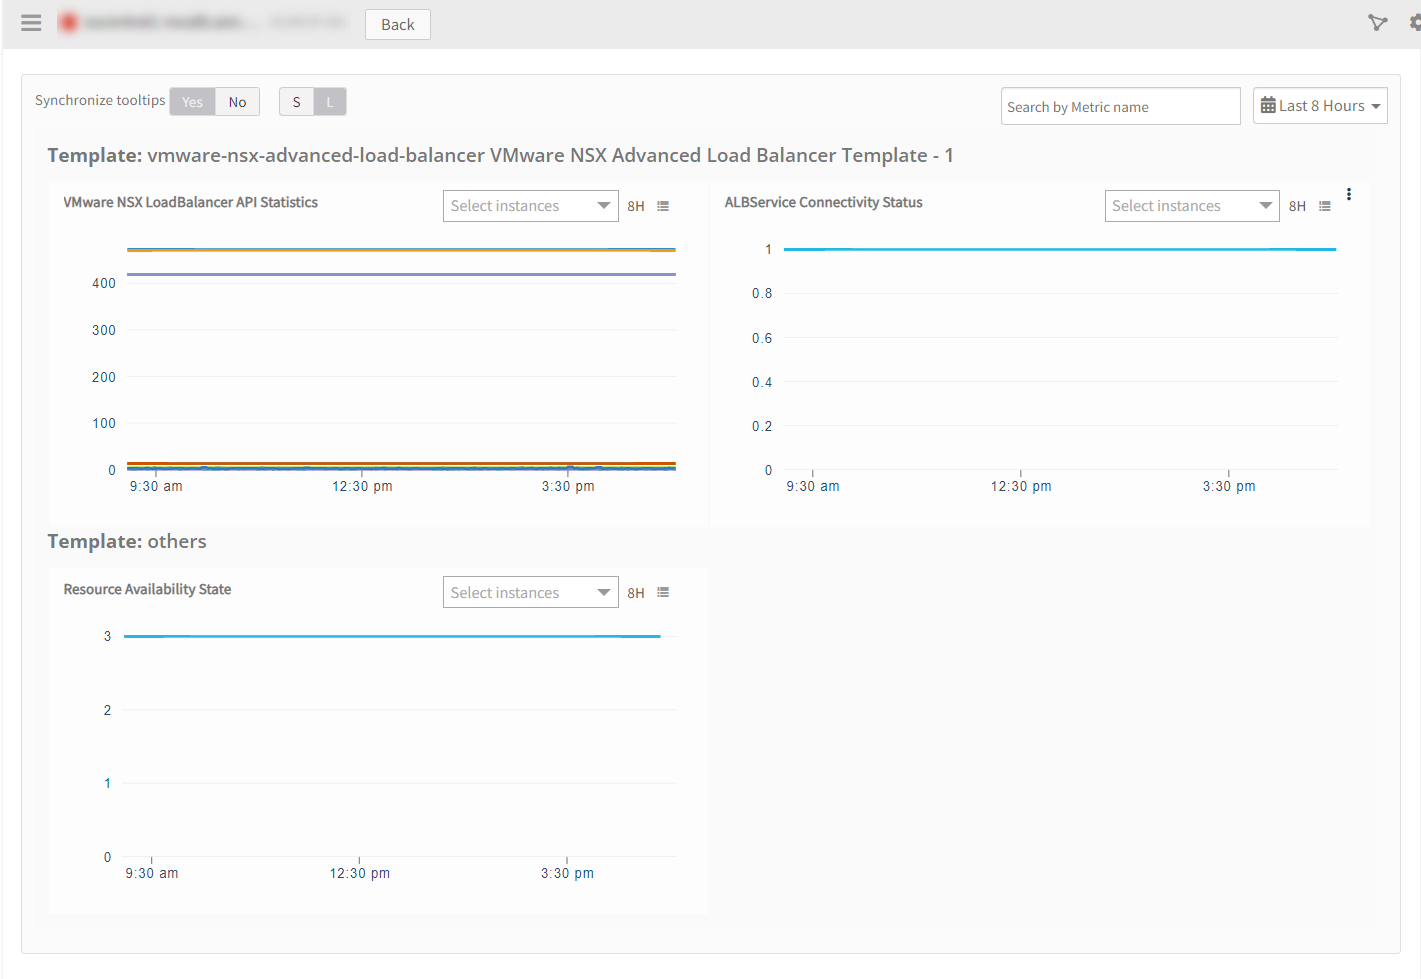
The VMware NSX Advanced Load Balancer integration is displayed in the Infrastructure > Resources > Cluster. You can navigate to the Attributes tab to view the discovery details and Metrics tab to view the metric details for VMware NSX Advanced Load Balancer.


Supported Alert Custom Macros
Customize the alert subject and description with below macros then it will generate alert based on customisation. Supported macros keys:
Click here to view the alert subject and description with macros
${resource.name}
${resource.ip}
${resource.mac}
${resource.aliasname}
${resource.os}
${resource.type}
${resource.dnsname}
${resource.alternateip}
${resource.make}
${resource.model}
${resource.serialnumber}
${resource.systemId}
${Custome Attributes in the resource}
${parent.resource.name}
Resource Filter Input Keys
VMware NSX Advanced Load Balancer app resources are filtered and discovered based on below keys:
Click here to view the Supported Input Keys
| Resource Type | Supported Input Keys |
|---|---|
| All Types | resourceName |
| hostName | |
| aliasName | |
| dnsName | |
| ipAddress | |
| macAddress | |
| os | |
| make | |
| model | |
| serialNumber | |
| AVI Service Engine | Router Type |
| Online Since | |
| AVI Cloud | |
| AVI Global Server Load Balancer | X-Avi-Tenant |
| IS Enabled | |
| VirtualService UUIDs | |
| AVI Virtual Service | PoolUUID |
| X-Avi-Tenant | |
| IS Enabled | |
| AVI Servers Pool | X-Avi-Tenant |
| IS Enabled |
Risks, Limitations & Assumptions
- Application can handle Critical/Recovery failure notifications for below two cases when user enables App Failure Notifications in configuration:
- Connectivity Exception.
- Authentication Exception.
- The application will send duplicate/repeat failure alert notifications for every 6 hours.
- Using metrics for monitoring the resources and generating alerts when the threshold values are breached.
- Application cannot control monitoring pause/resume actions based on above alerts.
- vmwarensx_loadbalancer_APIStatistics, by default this metric is not enabled if a customer wants to monitor the number of calls that app is making with the target device, then only we can apply this metric to the device.
- Supported X-Avi-Version is 21.1.3.
- This application supports both Classic Gateway and NextGen Gateway.
- No support of showing activity logs.
- The Template Applied Time will only be displayed if the collector profile (Classic and NextGen Gateway) is version 18.1.0 or higher.
- The minimum supported version for the option to get Latest snapshot metric is nextgen-14.0.0.
Application Version and Upgrade Details
| Application Version | Bug fixes / Enhancements |
|---|---|
| 1.0.3 | Include tenants api to get the List of Tenants instead of hard coding the tenant values. Enhancements related to latest snapshot, activity log. |
| 1.0.2 | Fix provided related to discovery when one tenant type discovery is failing and the discovery should continue for the other tenant types. |
| 1.0.1 | Resource Display Search(Group By NativeType) Support in search UI. |
| 1.0.0 | Supported vmware-nsx-advanced-load-balancer integration through rest API. |